September 2016
In August 2015, global markets suddenly fell sharply, the S&P 500 dropping 11% in little more than a week. Intraday price swings were violent, especially in contrast to how quietly markets had been trading immediately prior. The spike in volatility was by some measures among the largest in decades. (Figure 1)
While several macro factors may have helped to trigger the decline1, it wasn’t clear why the sell-off was so violent. Market analysts raised the possibility that strategies designed to mitigate risk may have, in aggregate, intensified it. Specifically, a spectrum of defensive approaches that became increasingly popular after the financial crisis may have generated programmatic, valuation-insensitive reductions in equity exposure that exacerbated losses and increased volatility, similar to the role of portfolio insurance in the Crash of 1987.
The issue remains topical, having gained further attention during the sell-offs in Q1 2016 and post-Brexit. In this note we sketch out key aspects of the discussion. We examine mechanisms by which dynamic risk-based allocation strategies and option hedges may generate programmatic flows that could exacerbate market swings. But we also discuss challenges in estimating flow magnitude, timing, and impact that obscure their influence on market dynamics.
Beyond the question of their market impact, programmatic flows generated by dynamic risk-based allocation approaches expose potential vulnerabilities of these strategies, including timing, liquidity, and valuation risks. They also highlight a key benefit of hedging with options that helps to explain its cost and suggests a criterion to consider when deciding whether it might be appropriate to pay for that form of protection.
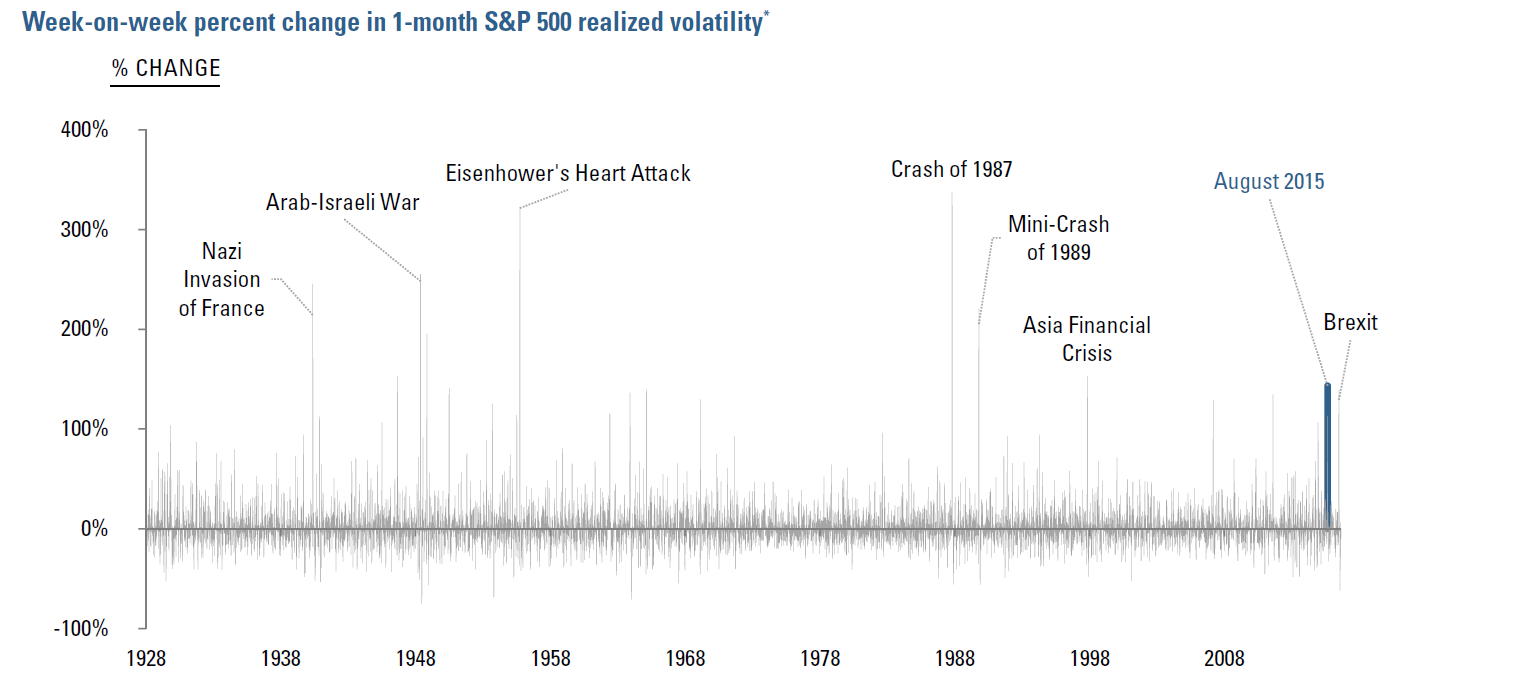
* For illustrative purposes only. Figure charts percentage change in trailing realized volatility vs. 5 trading days prior as of each trading day from 7-Feb-28 through 24-Aug-16. Realized volatility calculated using 21 trading day windows of log returns and a 252-day annualization factor.
Source: Acadian estimates and calculations based on index levels from Bloomberg.
How Risk Mitigation Strategies Might Influence Market Dynamics
Several types of strategies intended to reduce risk might programmatically generate flows that could exacerbate a sell-off or a spate of volatility. They include a spectrum of dynamic risk-based allocation approaches as well as option hedges.2 Their popularity increased following the Global Financial Crisis, reflecting demand from both investors and product purveyors for equity-linked strategies with lower volatility and smaller drawdowns than traditional cap-weighted indices.3
Dynamic Risk-Based Allocation Strategies
Dynamic risk-based allocation strategies include volatility target funds, certain implementations of risk parity, and portfolio insurance. Such approaches are designed to reduce their allocation to equities (or some other risky asset) as some measure of the riskiness of the asset class or the overall portfolio increases.
Since the GFC, volatility target funds (a.k.a. risk control funds) have become a prevalent form. Although not universally known even within the professional investing community, they are embedded in annuities and structured products as well as offered standalone. They dynamically allocate between equities and cash in an attempt to maintain total portfolio volatility in-line with a pre-set level. (E.g., 10% annualized.) So as stock volatility rises, the weight on equities must be reduced, and as stock volatility falls, equity exposure must be increased.
Risk control strategies were conceived to handle gradual changes in volatility, not violent shifts. Under a prototypical formulation, the equity allocation may be quite sensitive to a sudden surge in volatility. The MSCI USA 10% Risk Control index, for example, determines equity exposure based on the maximum of trailing 20-day and 60- day standard deviations of returns, a short-run and, under certain circumstances, highly variable volatility measure.4
For a portfolio managed to such a specification, the August 2015 volatility spike likely would have caused sudden, severe deleveraging, in excess of 50% in a matter of days. (See Figure 2.) Sell-side estimates of total AUM at the time under volatility target mechanisms ranged from $50-$300 billion, generating as much as $180 billion in selling pressure.5
Risk parity implementations that dynamically allocate across asset classes to maintain a stable level of total portfolio volatility bear resemblance to volatility target funds. They would tend to reduce equity exposure if 1) total portfolio volatility increases6 and/or 2) stocks’ volatility rises relative to the other included asset classes.
For risk parity, we would generally expect a spike in volatility to cause more modest and gradual equity deleveraging than for an archetypical volatility target fund. While risk parity implementations vary widely, their embedded risk forecasts are often tuned to reflect longer-term historical trends in asset volatilities and correlations, perhaps several months to even a few years; they are not intended to be highly reactive to short term changes. This should attenuate variability of the equity allocation and smooth trading impact.7
But the August 2015 volatility spike was large enough to increase even longer-run estimates of realized volatility and had potential to cause material equity outflows. E.g., one-year trailing S&P 500 volatility rose from around 12.4% in mid-August 2015 to over 15% by the beginning of October. Some analysts forecasted that associated risk parity equity outflows might reach $50-$100 billion.
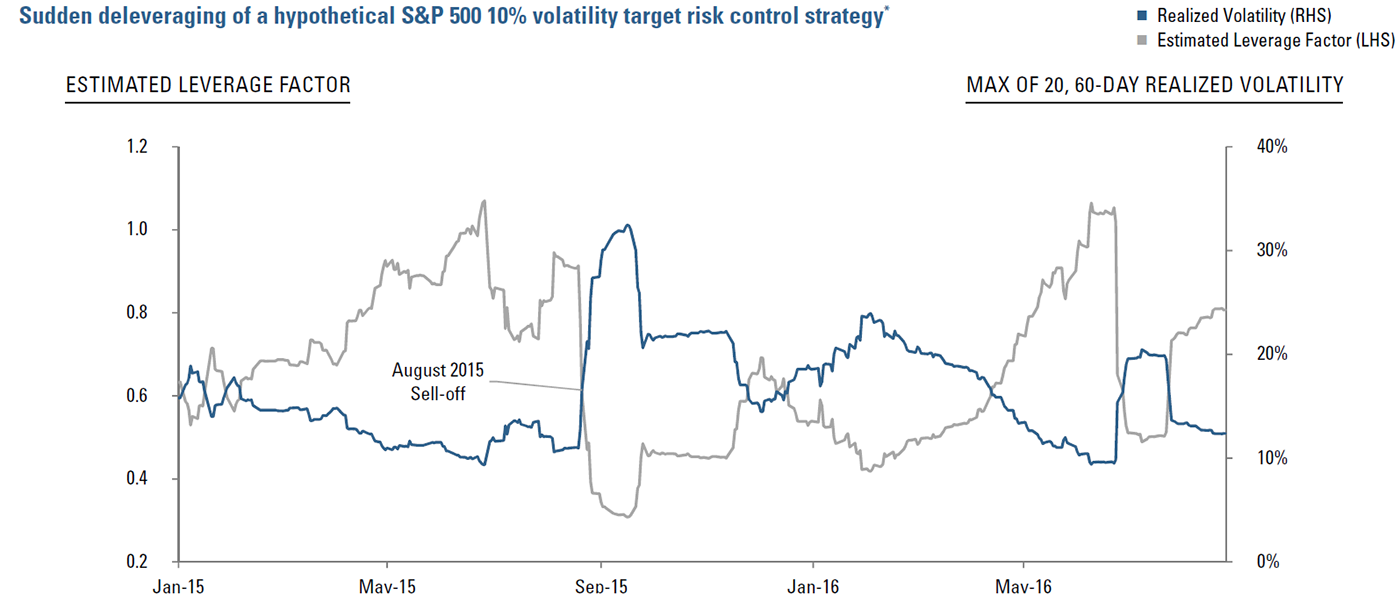
*Hypothetical strategy allocates between equities and cash depending on trailing realized equity volatility relative to 10% target. Specifically, estimated leverage factor, i.e., percentage equity allocation, calculated based on maximum of S&P 500 20-day and 60-day trailing realized volatilities (trading days, log returns, 252-day annualization factor) relative to 10% annualized target volatility level. Realized volatility is maximum of the 20-day and 60-day volatility estimates. Source: Acadian estimates and calculations based on index levels from Bloomberg.
For illustrative purposes only. This is meant to be an educational illustrative example and is not intended to represent investment retsults generated by an actual portfolio. They do not represent actual trading or an actual account. Results do not reflect transaction costs, other implementation costs and do not reflect advisory fees or their potential impact. Hypothetical results are not indicative of actual future results. Every investment program has the opportunity for loss as well as profit.
Option Hedges
Risk management activities of option dealers also have potential to exacerbate market volatility, depending on how they are positioned. A simplified, but still market relevant discussion provides intuition as to why.
When investors buy index put options to hedge their portfolios, the dealers that sell the protection take on the opposing long market exposure, which they, in general, initially neutralize by selling index futures. But option risk characteristics vary as the underlying market rises and falls (among other factors), and so the dealers must constantly adjust their equity positions because the required hedge ratio changes.8 Specifically, as stocks fall, their implicit long market exposure grows, meaning they have to sell additional futures. (Figure 3.) Similarly, as stocks rise, their long market exposure shrinks, meaning they have to buy some futures back. In other words, we would expect option dealers that are hedging short puts to sell the underlying index into market decline and buy into rallies, chasing the market in either case.9
If enough investors have purchased put protection, or to be somewhat more precise, if option dealers are net short enough puts and calls in aggregate, and depending on the mix of strikes and expiries, then option dealers’ aggregate futures flows might be large enough to exacerbate market moves. In particular, if the market quickly “gaps” lower, dealers may need to rapidly sell futures in size to offset a sudden, substantial increase in market exposure.
How large might options-related flows be? During the August 2015 sell-off, analyst estimates of cumulative equity outflows reached as high as $100 billion, reflecting a view that investors had substantial put protection in place.
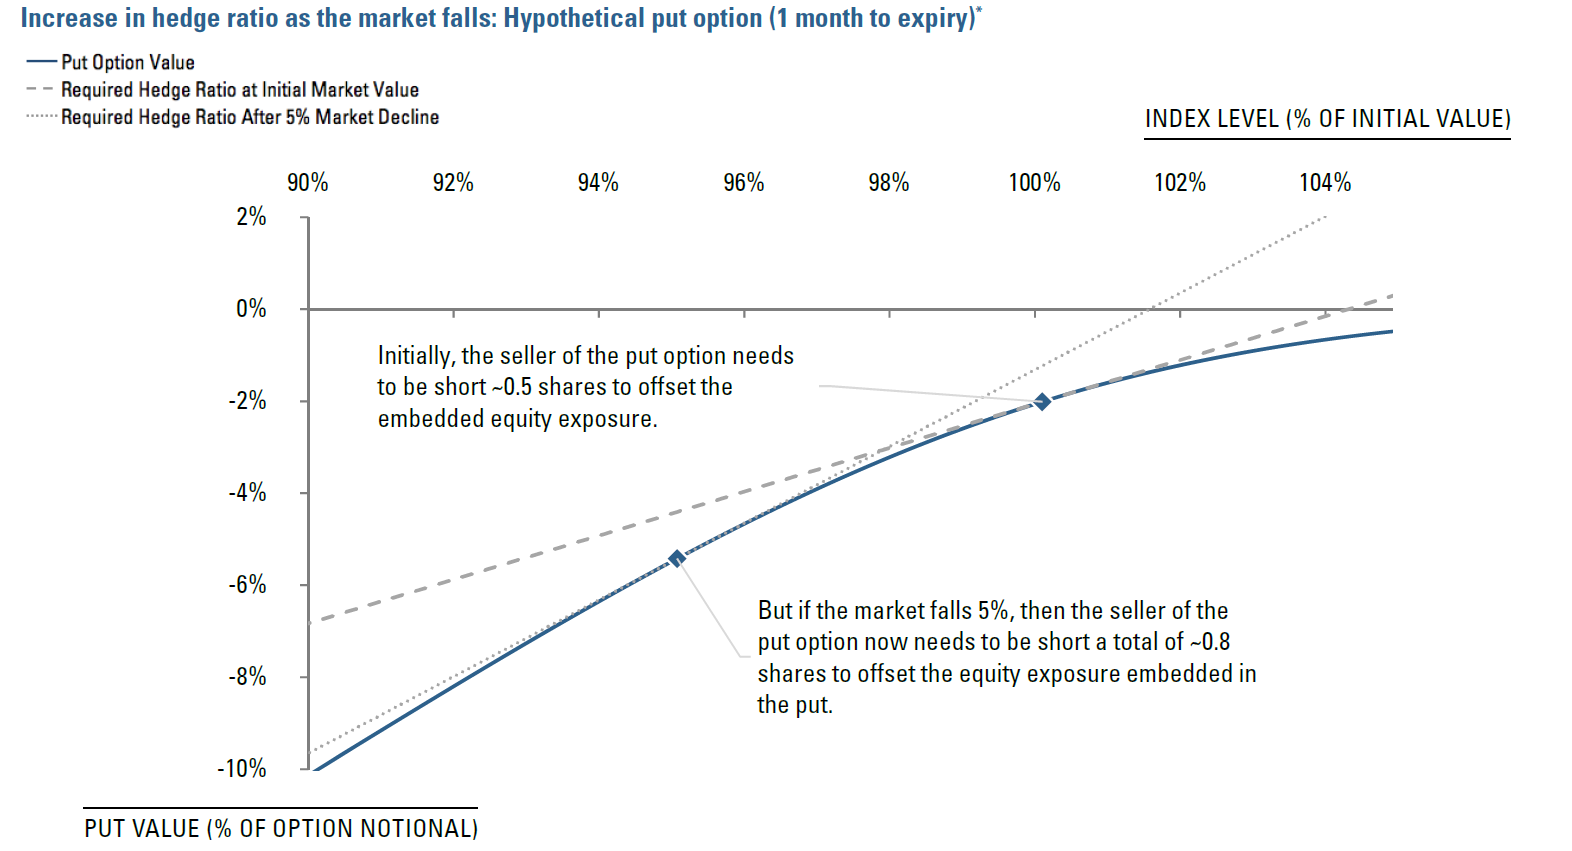 *Hypothetical put option value and hedge ratio calculated assuming 1-month to maturity, strike price = 100% of initial underlying price, implied volatility fixed at 17.5%, dividend yield = 2.25%, risk free rate = 0.75%. Source: Acadian.
For illustrative purposes only. This is meant to be an educational illustrative example and is not intended to represent investment retsults generated by an actual portfolio or strategy. They do not represent actual trading or an actual account. Results do not reflect transaction costs, other implementation costs and do not reflect advisory fees or their potential impact. Hypothetical results are not indicative of actual future results. Every investment program has the opportunity for loss as well as profit.
Challenges in Assessing Flow Magnitude and Impact
Some estimates of mechanical trading generated by risk mitigation strategies have been eye-catching, especially when combined with estimates of potential programmatic, market-chasing flows from other sources, including CTAs and the daily leverage resets of levered/inverse ETFs. But it is difficult to gauge the phenomenon’s true significance. Numerous challenges obscure assessment of flow magnitude, timing, and impact.
For dynamic risk-based allocation, it isn’t easy to gauge total assets governed by such approaches, typical equity allocations embedded in multi-asset portfolios, and average initial leverage. Such strategies may be implemented within derivative wrappers that would further mask baseline equity exposure and affect extent and timing of deleveraging in response to rising volatility. As well, flow estimates would be sensitive to a variety of strategy specifications, including how asset volatilities and correlations are measured. Such strategies may also allow for discretion.
The picture is no clearer with options. Assessments of potential dealer re-hedging activity often start from baseline assumptions that allow for a straightforward calculation of potential flows in a given market scenario based on readily available data but that don’t capture the true heterogeneity of investors’ actual option positions. The resulting estimates are crude because they don’t account for a variety of likely, but unobservable offsets.10 It is also difficult to gauge the likelihood of investors liquidating profitable hedges as the market declines, which could generate significant buying from dealers when they close out their short futures positions. Due to these and other factors, the magnitude of net equity flows attributable to option dealers around August 2015 is highly uncertain.11
Beyond magnitude, it is also difficult to gauge flow impact. The prevailing mix of strategy specifications and instrument characteristics will influence execution flexibility and timing. For example, we would expect certain flows concentrated at the close but others spread throughout the day as the market rises or falls.12 This complicates attribution of market movements, e.g., end-of-day price action, to programmatic sources such as those discussed here.
Market liquidity will also influence impact, as demonstrated during the August 2015 sell-off. Early on Monday the 24th, SPY dropped as much as 7.8% and futures went limit down as a surge in trading volume interacted with a severe deterioration in displayed depth.13 Post-Brexit, in contrast, liquidity seemed to hold up well, based on qualitative assessments from counterparties at the time. In Brexit, not only was the cause of the sell-off clear, but the precise date of the event was known months in advance. Uncertainty regarding the cause of a sell-off might contribute to deterioration of liquidity.
Potential Vulnerabilities of Dynamic Risk-Based Allocation Strategies
Whether or not programmatic flows are large enough to create feedback loops and exacerbate a sell-off or market volatility, they highlight potential vulnerabilities associated with valuation insensitive dynamic risk-based asset allocation strategies.
- Timing: Programmatic deleveraging may occur into the teeth of or even after a market decline, and releveraging may not start until after the market already is well into a recovery. Whether a particular strategy gets “whip-sawed” in a particular event likely will depend on idiosyncrasies of its specification that determine the reactivity and dynamism of its allocations.
- Consumption of liquidity: Allocation strategies that reduce exposure into market declines or when volatility increases will tend to consume market liquidity; all the more a concern if they are likely to do so when liquidity becomes thin.
- Valuation-insensitive allocation drift: Risk-based allocation strategies may be prone to overinvest in expensive assets. If risk estimates are derived from trailing volatility and an asset’s volatility has declined as its price has risen, then a backwards-looking risk-based allocation model may increase its holding of that asset regardless of valuation. In aggregate, such mechanisms could generate time series momentum-like effects.
A Key Benefit of Options—At a Cost
Protection against a sudden market move is an important benefit of an options hedge that dynamic allocation strategies don’t offer. A put’s payoff at maturity does not depend on how rapidly a market loss has occurred.14 In contrast, it may not be possible to rebalance any dynamic reallocation strategy quickly enough to avoid a material loss if the market “gaps” lower. As a result, investors who require an absolute floor on the value of a portfolio may be drawn to option-based protection, e.g., to insure ability to meet a cash flow obligation.
But we would expect this benefit to come at a cost. As discussed above, a dealer that sells a put will offset the long market exposure acquired through the transaction by implementing what is, in effect, a dynamic equity reallocation strategy. In doing so, the dealer takes on the risk of trading losses if it cannot adjust its equity hedge quickly enough in the event that the market drops rapidly or oscillates violently. We would expect dealers to charge a premium for taking on this risk, which would be reflected in option prices. So investors who do not require protection against gaps, may wish to avoid paying this premium and consider alternative means of risk reduction.15
Conclusion
Investors should become informed about programmatic flows associated with dynamic risk-based allocation approaches, hedging strategies, and other sources. On balance, we believe that they probably contributed to, although were not the principal driver of, selling pressure and volatility in and after the August 2015 sell-off. Difficulties in assessing their magnitude and impact make it possible to justify a range of predictions or assessments of their significance. The resulting ambiguity has fueled debate around the topic, and investors should be wary of hyperbolic claims and predictions.
Investors seeking to reduce drawdown risk should take into account potential timing, liquidity, and valuation risks inherent in certain dynamic risk-based allocation strategies. And in evaluating options-based hedging strategies, they should consider whether they require protection against market gaps.