Low-Volatility Investing: Welcoming the Elephant into the Room
Thematic Research 24 min
February 2024
Table of contents
A steady drumbeat of negative news flow about China’s economy and its geostrategic tensions with the U.S. has weighed on investor sentiment towards the country for quite some time. Despite these unresolved concerns, our top-down forecast for Chinese equities has improved relative to other emerging markets (EM) over the past year, and fundamentally oriented stock selection has been rewarded in the country’s markets.
In this note, therefore, we re-examine the outlook for Chinese stocks from a systematic perspective. We analyze why the forecast has changed, and document how the dampening of speculative froth has reversed fortunes among active investors in the market. Along the way, we offer timely suggestions for investors who are re-thinking how to set their EM allocations across China and EM ex-China, more broadly.
In recent years, headlines about China have presented a generally bleak economic outlook. Investor attention has been dominated by news flow around China’s debt burden and elevated geostrategic concerns. Such longstanding and still unresolved macro challenges do not necessarily imply a poor outlook for Chinese stocks, however, particularly over short horizons.1 What matters is whether the market is accurately repricing the risks as conditions continue to evolve.
Indeed, Figure 1 shows that on the basis of our top-down country forecast, which reflects valuations, economic conditions, sentiment, and other criteria, Chinese stocks’ attractiveness has increased. In fact, while on a relative basis the forecast for Chinese equities indeed weakened in 2020 with the imposition of zero-COVID policies, it has brightened considerably since early 2022.
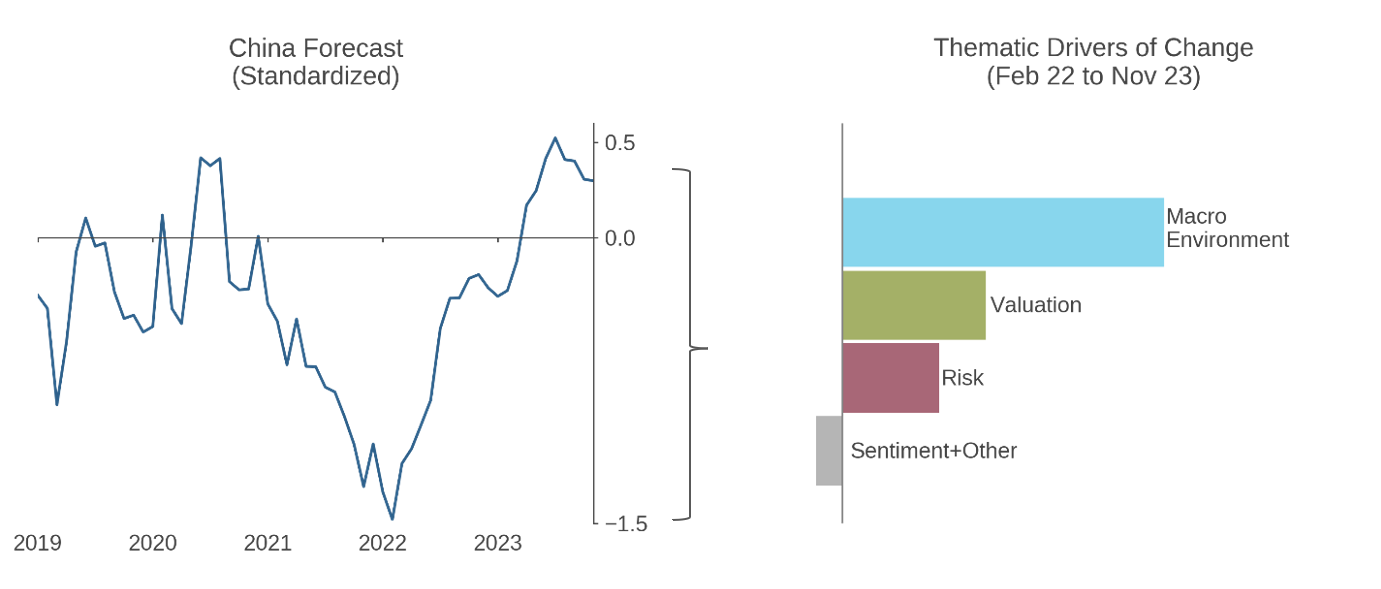
It turns out that despite past headlines, improving macroeconomic conditions have been a key driver of this change in the country’s equity outlook. Growth, while still historically weak, has nevertheless been better than previously expected, and both monetary stimulus and weakness of the yuan have provided additional boosts. Economic forecasters seem to agree that the outlook has improved; as compared to a near uniformly negative consensus that emerged in 2022, their views on China are now more mixed. Valuations have been a second, meaningful driver of the improving investment forecast (relative to EM).
For about four years ending in 2020, a handful of Chinese mega-cap tech stocks soared as speculative excess lifted growth stocks globally and the Chinese government let stocks domiciled there run up.2 Under these frothy conditions, narrow growth-focused stock pickers flourished in the Chinese market; some delivered spectacular returns. Fundamentally oriented strategies outperformed the cap-weighted index, on average, but couldn’t keep pace with growth-oriented peers as distortions in valuations grew. (Figure 2) Moreover, as the narrow rally continued, passive allocations to China blindly inherited an increasingly growthy character—top heavy and geared to a few tech companies’ strong returns.
Annualized Excess Returns relative to the MSCI China Onshore Index
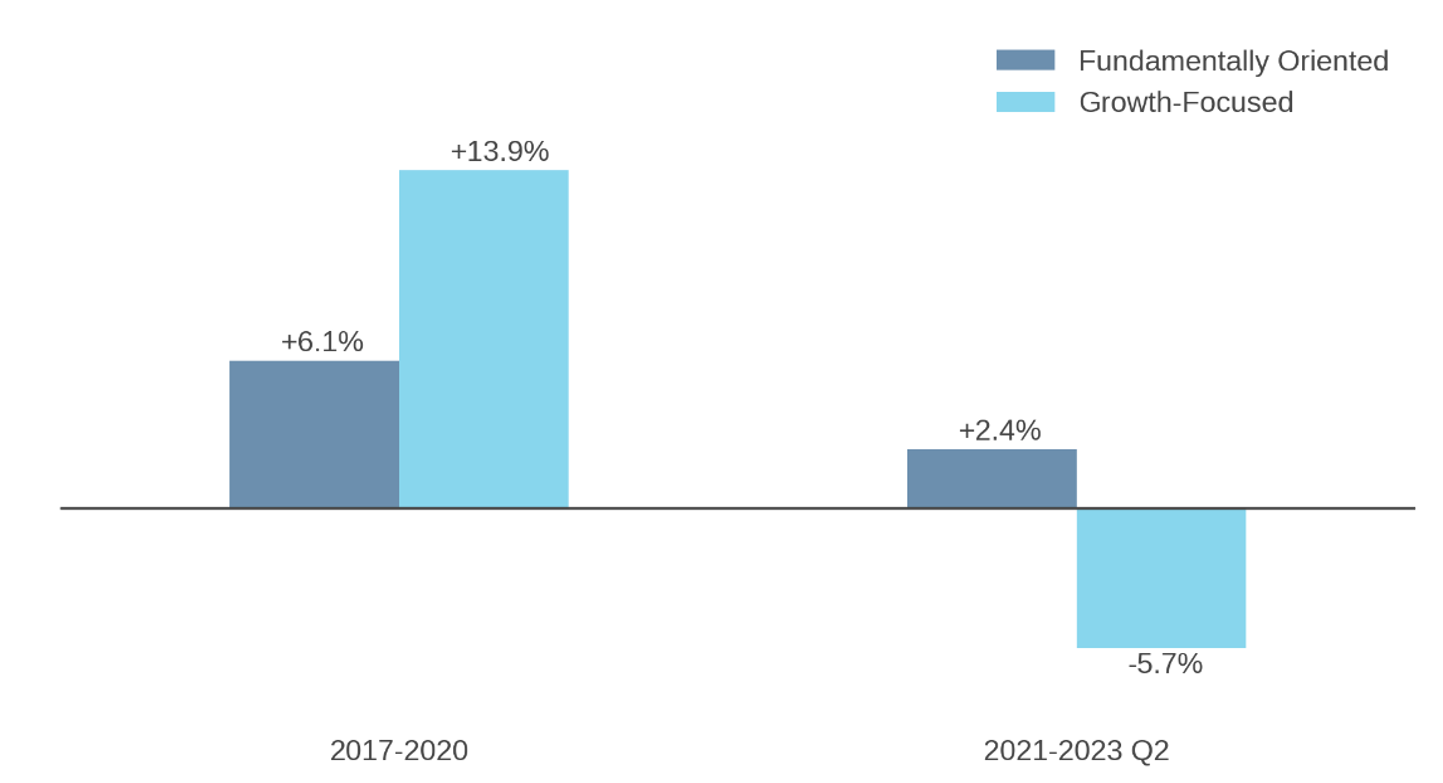
But patience on the part of fundamentally oriented managers was rewarded starting in late 2020 when Chinese regulators cracked down on offshore-listed platform companies, such as Alibaba, JD.com, and Tencent.3 Large-cap offshore tech multiples quickly collapsed. Subsequently, the 2022 global growth selloff, additional regulatory actions, and continuation of zero-COVID policies limited speculative pressure among Chinese equities during 2023 even as growthy froth reemerged in the U.S. and other global markets. In part as a result, fundamentally oriented managers that rely on a mix of valuation, quality, and sentiment themes have outperformed in China for nearly three years now. In contrast, previously high-flying growth-focused stock pickers have meaningfully underperformed.
The juxtaposition of pessimistic headlines versus the evolving top-down forecast and recent success of fundamentally oriented stock selection warrants careful consideration by allocators. While we once saw overexuberance about prospects for Chinese stocks, there is risk now that sentiment has become too negative.
This is not a “pound the table” call to overweight China, but rather a caution that underexposure to its equity market is not risk free. As we’ve written before, theory and empirical evidence suggest that a key contributor to the long-term success of any public equity allocation is keeping many lines in the water, i.e., broad exposure. The reason being that a small set of stocks may end up driving long-run performance, and it is difficult to predict which stocks they will turn out to be. A timely takeaway for allocators is that strategically underweighting a market as large as China likely has opportunity cost.
In addition, the strong performance of fundamentally oriented active strategies in China over the past three years is further evidence that its equity market is less efficient than many others yet is rational enough to reward investors who look to capitalize on behavioral and information-based mispricings. While the outlook for Chinese equities has improved, we would advise investors not to load up on narrow growthy stock picking; we would not bank on a resurgence of the ebullience that we saw from 2017-2020. Instead, we would advise investors to stay active in China (and EM in general) by embracing well-diversified strategies that are rooted in fundamentals.
Since we first addressed issues associated with China’s role in EM allocations in late 2021, asset owners and consultants have become increasingly cognizant that conventional EM benchmarks (China + EM ex-China) may not map well to their views or needs. For some, the relative allocation embedded in the combined index does not align with their investment outlook for China relative to the rest of EM,4 while others require flexibility in setting the relative allocation to China due to geostrategic concerns or associated governance pressures.5 While in the abstract, bifurcating EM effectively introduces a constraint into portfolio construction, which should have a cost in the context of an active strategy, increasingly, other pragmatic considerations point to separating China and EM ex-China allocations as an appropriate starting point.
The opportunity set for active multifactor approaches in EM is attractive. Even though some allocators have been tempted to go passive based on EM benchmarks’ heady returns from 2017-20, that narrowly driven performance now looks aberrant. As alluded to above, those strong returns reflected a global one-factor bet on growth that propelled large-cap tech-oriented stocks in China, South Korea, and Taiwan (as well as developed markets). While that era posed headwinds for active performance of fundamentally oriented active strategies in EM, they have since been rewarded as distortions have diminished. We view the episode as highlighting a benefit of multifactor active approaches in that they provide natural guardrails against thematic mispricings and associated “active-like” risks that cap-weighted benchmarks may mechanically inherit (such as high levels of concentration in countries, industries, and stocks).6 As we recently documented, multifactor processes have performed well in EM in 2023, pointing to their enduring efficacy in these relatively inefficiently priced markets.7
In reevaluating allocations to China, whether to increase or decrease exposure, investors should prioritize onshore over offshore equities. The onshore opportunity set is not only larger than offshore, but it also offers greater diversification (risk reduction) potential: equity returns in these markets are less explained by global risk factors and are more locally driven. Onshore Chinese equities also have greater exposure to sectors that are recognized to be locally oriented.8 Finally, for active investors, China’s onshore market offers a rich source of behaviorally based mispricings in an exceptionally large universe of relatively liquid yet professionally underfollowed small caps. Accessing this opportunity set demands investment in specialized signal construction, distinct data sources, and local-language text processing (which has helped to preserve it).9
In EM ex-China sleeves, allocators are starting with a much smaller opportunity set relative to EM. Moreover, the relevant benchmark is highly concentrated in South Korea and Taiwan, two economies that are well integrated with the developed world, with equities that are sensitive to global developed market risk factors.10 Further, the index is even more top-heavy than the EM benchmark (e.g., Taiwan Semiconductor alone has a weight near 10%). With respect to the active opportunity set, these factors suggest that investors should tap into broader investment universes, perhaps including non-benchmark EM stocks, less integrated segments of developed markets, and Frontier equities.
Every investment program has an opportunity for loss as well as profit. Benchmarks are individual to each manager based on the benchmarks reported to eVestment. Past performance is no guarantee of future returns. eVestment Alliance, LLC and its affiliated entities (collectively, “eVestment”) collect information directly from investment management firms and other sources believed to be reliable, however, eVestment does not guarantee or warrant the accuracy, timeliness, or completeness of the information provided and is not responsible for any errors or omissions. Performance results may be provided with additional disclosures available on eVestment’s systems and other important considerations such as fees that may be applicable. Not for general distribution and limited distribution may only be made pursuant to client’s agreement terms. All managers in an eVestment category are not necessarily included. Copyright 2012-2024 eVestment Alliance, LLC. For illustrative purposes only. All Rights Reserved.
These materials provided herein may contain material, non-public information within the meaning of the United States Federal Securities Laws with respect to Acadian Asset Management LLC, BrightSphere Investment Group Inc. and/or their respective subsidiaries and affiliated entities. The recipient of these materials agrees that it will not use any confidential information that may be contained herein to execute or recommend transactions in securities. The recipient further acknowledges that it is aware that United States Federal and State securities laws prohibit any person or entity who has material, non-public information about a publicly-traded company from purchasing or selling securities of such company, or from communicating such information to any other person or entity under circumstances in which it is reasonably foreseeable that such person or entity is likely to sell or purchase such securities.
Acadian provides this material as a general overview of the firm, our processes and our investment capabilities. It has been provided for informational purposes only. It does not constitute or form part of any offer to issue or sell, or any solicitation of any offer to subscribe or to purchase, shares, units or other interests in investments that may be referred to herein and must not be construed as investment or financial product advice. Acadian has not considered any reader's financial situation, objective or needs in providing the relevant information.
The value of investments may fall as well as rise and you may not get back your original investment. Past performance is not necessarily a guide to future performance or returns. Acadian has taken all reasonable care to ensure that the information contained in this material is accurate at the time of its distribution, no representation or warranty, express or implied, is made as to the accuracy, reliability or completeness of such information.
This material contains privileged and confidential information and is intended only for the recipient/s. Any distribution, reproduction or other use of this presentation by recipients is strictly prohibited. If you are not the intended recipient and this presentation has been sent or passed on to you in error, please contact us immediately. Confidentiality and privilege are not lost by this presentation having been sent or passed on to you in error.
Acadian’s quantitative investment process is supported by extensive proprietary computer code. Acadian’s researchers, software developers, and IT teams follow a structured design, development, testing, change control, and review processes during the development of its systems and the implementation within our investment process. These controls and their effectiveness are subject to regular internal reviews, at least annual independent review by our SOC1 auditor. However, despite these extensive controls it is possible that errors may occur in coding and within the investment process, as is the case with any complex software or data-driven model, and no guarantee or warranty can be provided that any quantitative investment model is completely free of errors. Any such errors could have a negative impact on investment results. We have in place control systems and processes which are intended to identify in a timely manner any such errors which would have a material impact on the investment process.
Acadian Asset Management LLC has wholly owned affiliates located in London, Singapore, and Sydney. Pursuant to the terms of service level agreements with each affiliate, employees of Acadian Asset Management LLC may provide certain services on behalf of each affiliate and employees of each affiliate may provide certain administrative services, including marketing and client service, on behalf of Acadian Asset Management LLC.
Acadian Asset Management LLC is registered as an investment adviser with the U.S. Securities and Exchange Commission. Registration of an investment adviser does not imply any level of skill or training.
Acadian Asset Management (Singapore) Pte Ltd, (Registration Number: 199902125D) is licensed by the Monetary Authority of Singapore. It is also registered as an investment adviser with the U.S. Securities and Exchange Commission.
Acadian Asset Management (Australia) Limited (ABN 41 114 200 127) is the holder of Australian financial services license number 291872 ("AFSL"). It is also registered as an investment adviser with the U.S. Securities and Exchange Commission. Under the terms of its AFSL, Acadian Asset Management (Australia) Limited is limited to providing the financial services under its license to wholesale clients only. This marketing material is not to be provided to retail clients.
Acadian Asset Management (UK) Limited is authorized and regulated by the Financial Conduct Authority ('the FCA') and is a limited liability company incorporated in England and Wales with company number 05644066. Acadian Asset Management (UK) Limited will only make this material available to Professional Clients and Eligible Counterparties as defined by the FCA under the Markets in Financial Instruments Directive, or to Qualified Investors in Switzerland as defined in the Collective Investment Schemes Act, as applicable.