Shifts in the investing climate over recent years have prompted asset owners to seek sources of higher active returns. When interest rates fell to historic lows, investors that were tasked with meeting traditional absolute return targets came under pressure to meet objectives that had become increasingly stretched in real terms. Then, in 2022, the sharp equity market selloff generated a surge of interest in investments that would be uncorrelated with broad market performance.
In the pursuit of higher active returns, a central challenge facing asset owners is to distinguish solutions that improve risk-adjusted performance from those that simply amplify active risk. Concentrated equity strategies offer a case in point. They became trendy over the past decade even though, or perhaps because, they generate substantially higher returns dispersion, due to limited flexibility in risk control and foregone diversification, that helps to draw attention to conspicuous “winners.”
In contrast, systematic extension strategies offer a disciplined method of boosting active exposure. But they have been underutilized for years (Figure 1) due to hazy perceptions of their underperformance around the Global Financial Crisis (GFC) and a blurry leeriness of risks associated with shorting.
Figure 1: Extension Strategies—An Underappreciated Tool
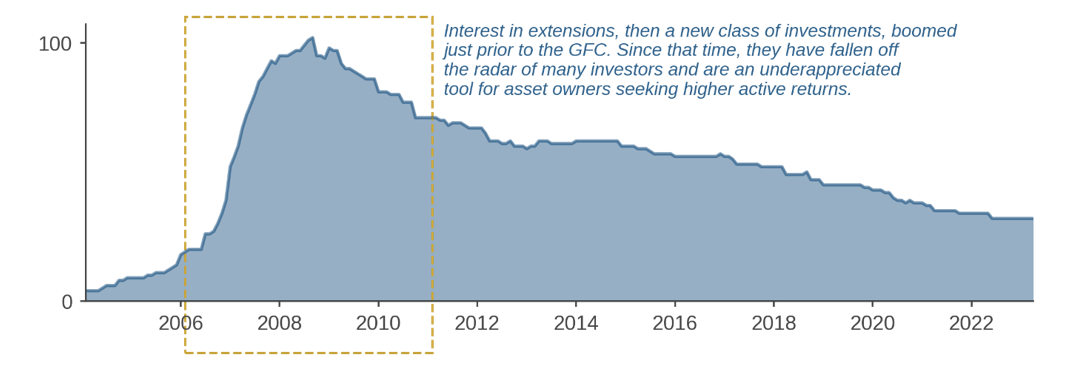
Chart shows the number of strategies with available returns in the eVestment U.S. Extended Equity Universe. Source: Acadian based on strategy data from eVestment. Please see additional disclosure at the end of the paper for more information. For illustrative purposes only.
In this note, we re-underwrite the practical benefits of systematic extensions and contrast their conceptually sound premise with that of concentrated equity strategies. We then provide a mini-case study of a hypothetical 130-30 strategy to demonstrate how extensions can improve performance by more precisely and more deeply exploiting the full active opportunity set and to clarify their risk profile.
Compelling Logic
Extension strategies are a form of high conviction investing. Compared to a long-only portfolio, they substantially increase exposure to a manager’s active views while keeping the underlying capital invested and market exposure roughly unchanged.
Extensions have special appeal in a systematic investing context, because they can be viewed as the product of a modest change in portfolio construction, often described as relaxing the long-only constraint.1 This modification has material benefits, because it allows for broader, deeper, and more precise exploitation of the active opportunity set.
These benefits derive most prominently from two sources. First, extensions provide the manager much greater freedom to monetize views on stocks that it believes will underperform. In long-only contexts, the manager has no means whatsoever to underweight stocks outside the benchmark and only limited room to underweight most index constituents, because all but a handful have tiny weights. (See Figure 2, for example.) By allowing shorting, therefore, extensions greatly expand the set of usable forecasts and also increase flexibility to “fund” active longs.
Figure 2: MSCI ACWI Index Weights
As of June 30, 2023
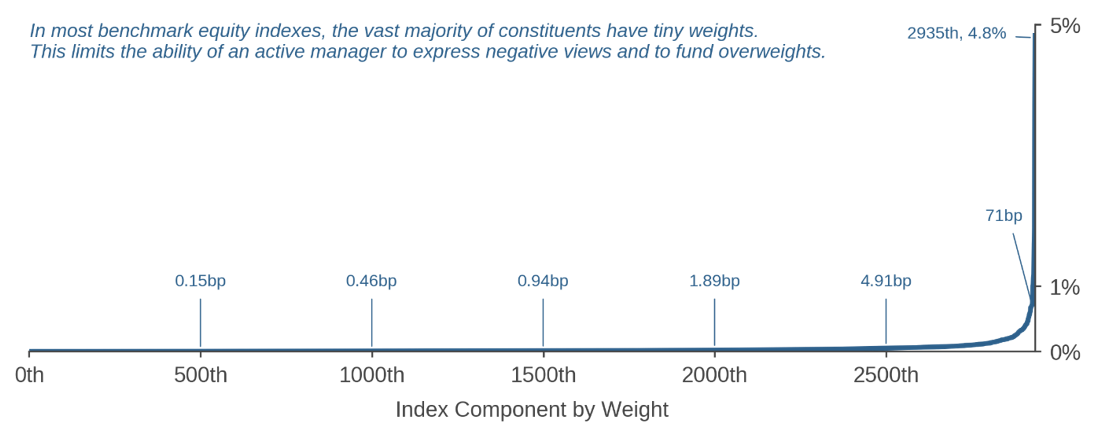
Source: Acadian based on data from MSCI. MSCI data copyright MSCI 2023, All Rights Reserved. Unpublished. PROPRIETARY TO MSCI. For illustrative purposes only.
A second benefit of systematic extensions is that they afford increased flexibility to control risk that permits greater access to the rich active opportunity set available in smaller-cap stocks. The small-cap market segment is less efficiently priced because it has a poorer information environment and is harder to trade. Consequently, we find greater dispersion of returns forecasts in that market segment. (Figure 3) In a long-only context, leaning into the most attractive forecasts therefore entails exposure to a small-cap risk factor. Relaxing the long-only constraint helps to reduce this tension by allowing size risk from incremental small-cap longs to be offset by size risk from small-cap shorts. This increased flexibility to control risk while pursuing alpha applies not only to market capitalization, but to other uncompensated exposures, like currencies, countries, and industries, as well.
Figure 3: The Active Opportunity Set—Richer among Small-Cap Stocks
Average market capitalization across percentiles of Acadian stock return forecasts
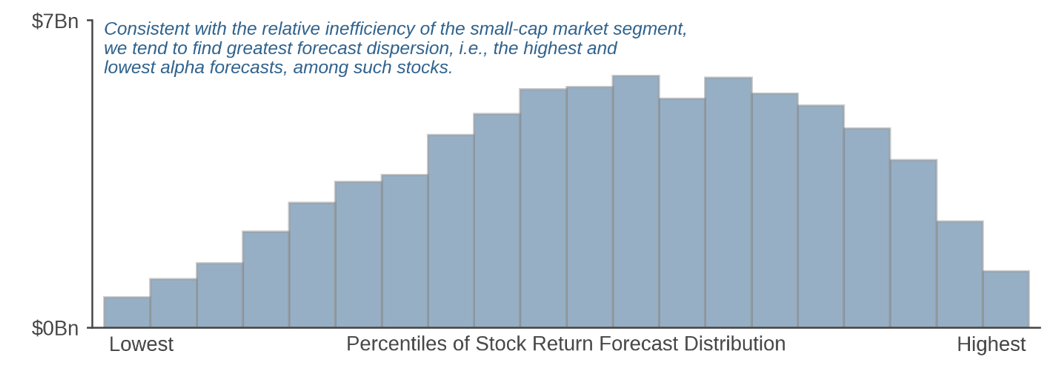
Chart shows an average from 2013-2022. Source: Acadian. For illustrative purposes only.
Premises Contrasted: Through the Lens of the “FLAM”
The Fundamental Law of Active Management (FLAM) provides a conceptual frame in which to compare the premise of systematic extensions with other methods of increasing active exposure, including a trendy approach, allocating to concentrated equity strategies.
The FLAM tells us that the ex-ante expected risk-adjusted active return of a portfolio depends on three things: the manager’s skill, the number of independent asset return forecasts that the manager expresses in the portfolio, and something known as the transfer coefficient. (Figure 4) The transfer coefficient, while perhaps an unfamiliar term to many investors, formalizes an intuitive concept: the manager’s ability to align active positions in the portfolio with its stock return predictions. Constraints on portfolio construction inhibit this ability and reduce the transfer coefficient (as do implementation frictions).2
Figure 4: The Fundamental Law of Active Management
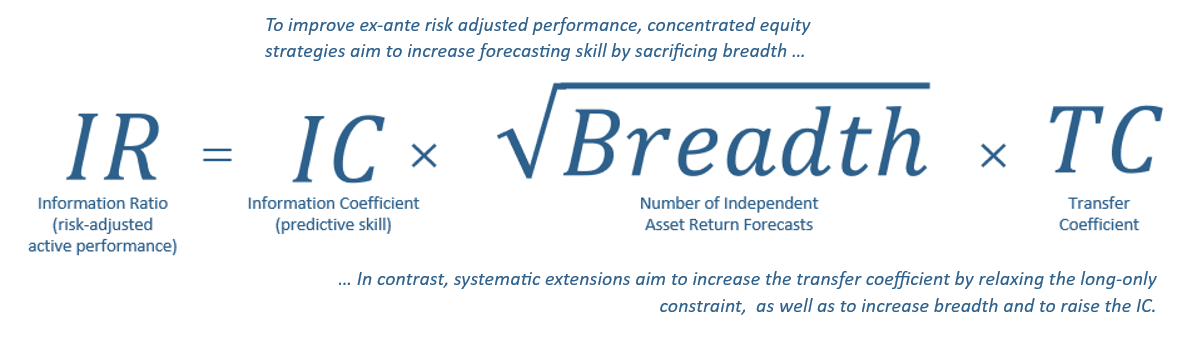
As discussed above, the long-only constraint represents a consequential restriction on portfolio construction, and the FLAM helps to crystallize how its relaxation can increase ex-ante risk-adjusted active performance. Permitting shorting increases the transfer coefficient by allowing both broader and deeper negative active exposure to stocks with the lowest alphas and greater positive exposure to stocks with the highest. It improves breadth by increasing the number of independent forecasts incorporated into a portfolio, most apparently through the addition of the short side, i.e., monetization of views on underperformance.3 It can also increase the information coefficient, by improving access to the smaller-cap, less-efficiently priced market segment, where payoffs to alpha are higher.
Crucially, under the assumption that the manager already predicts both over and underperformance across a broad investment universe, then the modification to portfolio construction should require no changes to the forecasting process or to the universe of stocks to which it is applied. In the context of a systematic investing approach, this assumption is quite reasonable, because the entire investment process is expressly designed to scale.
In contrast, we view the conceptual foundation of a trendier method of embracing high conviction, investing in concentrated discretionary equity strategies, as murkier. Through the lens of the FLAM, concentration seeks to improve risk-adjusted performance by reducing the scope of a manager’s forecasting activities in order to increase predictive accuracy. That premise reflects an implicit assumption that the manager’s forecasting process does not scale well. That limitation is much more relevant to a traditional stock picker who has limited time and attention to consistently evaluate a broad opportunity set and to manage associated positions rather than to a systematic manager.
In the discretionary context, whether this trade-off of breadth for skill improves even ex-ante expected performance is hardly sure. It depends on whether the increase in expected active return more than compensates for an almost certain increase in active risk associated with both reduced flexibility to control systematic exposures and sacrifice of diversification.
A Hypothetical Case Study
Despite their logical premise, the marketplace for extension strategies dwindled after the GFC. Immediately following an initial boom in popularity in 2006 and 2007, what was then a new class of equity investments delivered underwhelming performance, causes of which we address below, and for years the approach fell out of favor with asset owners and consultants. Nearly a generation later, many investors have simply forgotten about extensions, while some may harbor lingering concern that there might be disproportionate risk associated with the short side of the portfolio.
As a refresher on extensions and to help clarify their risk profile, we present a mini-case study that compares three hypothetical active global strategies associated with the same initial capital outlay: First, a baseline global long-only active portfolio. Second, a levered baseline generated simply by scaling up the unlevered strategy’s returns by 1.6x.4 Third, a 130-30 extension strategy that shares the baseline’s investment universe, forecasts, and general portfolio construction framework.5
Figure 5 presents high-level results generated over a roughly 15-year sample period, from February 2007 through March 2022. The left chart shows that that the 130-30 strategy delivers higher ex-ante alpha than the 160% levered long (net of estimated transaction costs). In other words, the extension succeeds in delivering high conviction by amplifying alpha exposure to more than 1.6x the unlevered baseline.
Figure 5: Performance Summary—Hypothetical Global 130-30 Strategy and Long-Only Baselines
Sample period: February 2007 – March 2022
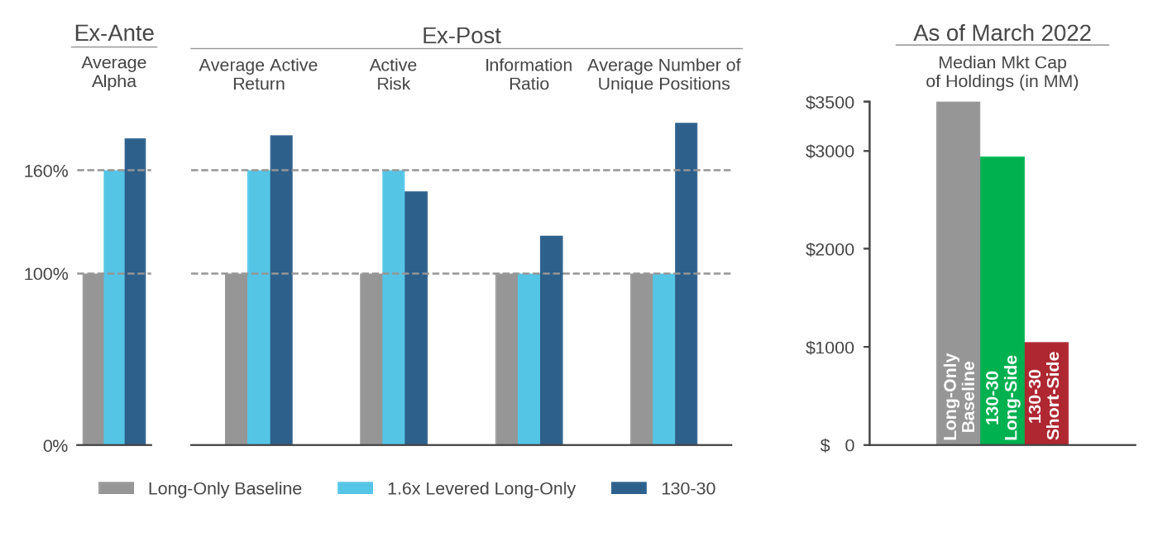
Source: Acadian. Hypothetical portfolios based on Global long-only and 130-30 strategies benchmarked to MSCI ACWI from Feb 2007 – Mar 2022. This is meant to be an educational illustrative example and is not intended to represent investment returns generated by an actual portfolio. Hypothetical results do not represent actual trading or an actual account or reflect transaction costs or advisory fees. Reference to the benchmark is for comparative purposes only. Hypothetical results are not indicative of actual future results. Every investment program has an opportunity for loss as well as profit. Additional information about how the hypothetical portfolios were constructed is available upon request.
The chart also shows an increase in the ex-post IR (by roughly 20%). The higher risk-adjusted return derives from improvements in both the numerator and the denominator relative to what we would anticipate from levering up the long-only baseline, i.e., higher average active return and lower volatility.
Consistent with the intuition described in the prior section, Figure 5 also provides direct evidence connecting the increase in ex-ante alpha to both increased breadth and better exploitation of the less-efficient small-cap market segment. The average number of unique positions in the portfolio increases substantially. The median market cap of long-side holdings, as of March 2023, decreases by about 17%, from $3.5 billion to $2.9 billion. The median market cap on the short side is quite small, a little over $1.0 billion.
But as Figure 6 documents, the extension does not have greater small-cap risk exposure than the long-only baseline. In fact, despite deeper penetration of the smaller-cap segment, the net size risk exposure of the extension strategy is, on average, lower than that of the baseline. This is a clear demonstration of the flexibility to hedge incremental attractive small-cap longs with attractive small-cap shorts, or, equally validly, the ability to hedge attractive small-cap shorts with attractive small-cap longs.6
Figure 6: Size Risk Factor Exposure—Hypothetical Global 130-30 Strategy and Long-Only Baseline
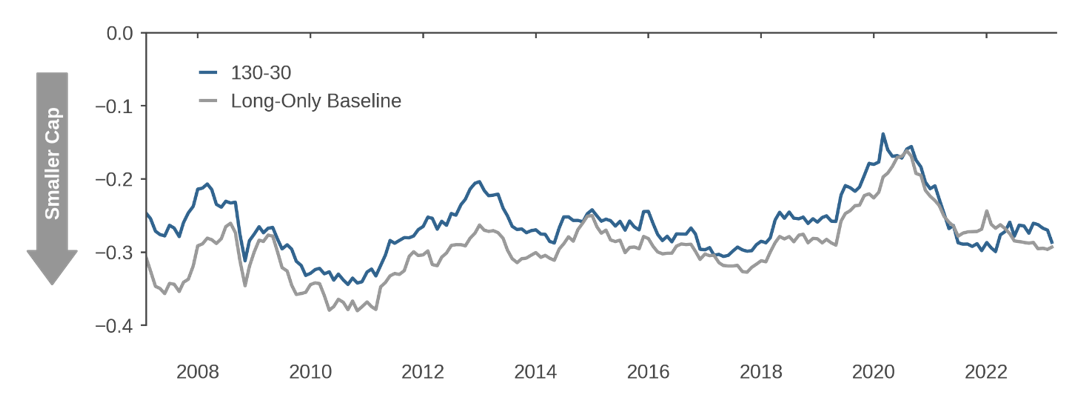
Source: Acadian. Hypothetical portfolios based on Global long-only and 130-30 strategies benchmarked to MSCI ACWI from Feb 2007 – Mar 2022. This is meant to be an educational illustrative example and is not intended to represent investment returns generated by an actual portfolio. Hypothetical results do not represent actual trading or an actual account or reflect transaction costs or advisory fees. Reference to the benchmark is for comparative purposes only. Hypothetical results are not indicative of actual future results. Every investment program has an opportunity for loss as well as profit. Additional information about how the hypothetical portfolios were constructed is available upon request.
It might even come as a surprise that the long-short extension strategy does not decrease size exposure more than it does. But the 130-30 portfolio is still 100% long rather than market neutral, and access to the opportunity set in small caps is valuable, so the strategy still utilizes its size exposure budget. That outcome reflects the particular parameterization of the size constraint in this exercise: we apply the same limit to the long-short portfolio that we do to the unlevered baseline, and we allow the extension to make greater use of that size-risk budget in pursuit of higher ex-ante alpha. In concept, an alternative implementation of the extension could tighten the constraint on size (or other exposures of concern to a particular investor) while aiming to keep total ex-ante alpha unchanged relative to the baseline. In our experience, however, the vast majority of extension investors prioritize increasing active returns.
Risk: Clarifying Perspective
Although in a conventional systematic 130-30 implementation net market beta remains close to one, the distinctive features of extension strategies, including amplification of alpha exposure and introduction of the short side, have the potential to alter their risk profiles relative to otherwise comparable long-only portfolios.
To help clarify potential vulnerabilities of extensions, Figure 7 compares active drawdowns across the three hypothetical portfolios from the case study. The 130-30 implementation experiences few episodes where underperformance exceeds that of the 1.6x levered long-only. In fact, underperformance is often more limited, similar to the unlevered baseline, including during the aftermath of the GFC. We can build intuition for this encouraging behavior by separately considering two possible drivers of underperformance, 1) a breakdown in alpha forecasting efficacy and 2) a shock to an (uncompensated) risk factor.7
Figure 7: Active Drawdowns—Hypothetical Global 130-30 Strategy and Long-Only Baselines
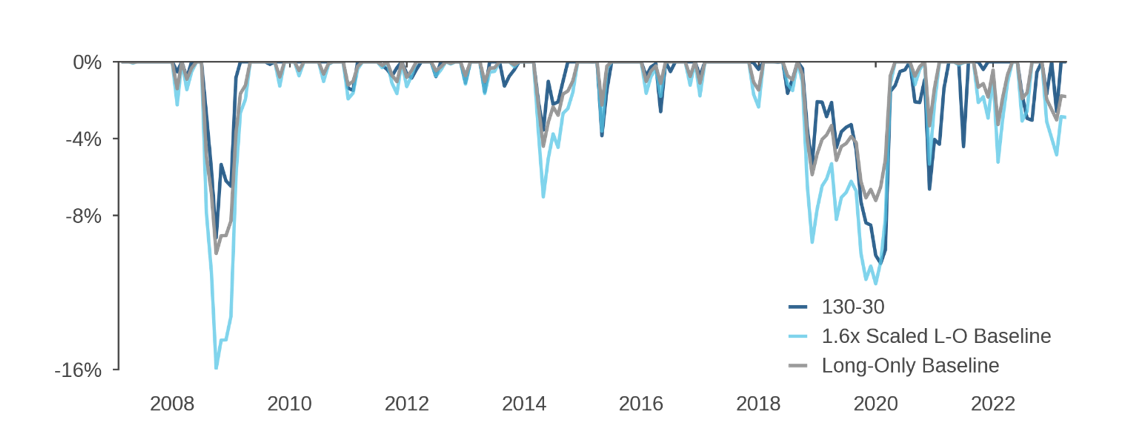
Source: Acadian. Hypothetical portfolios based on Global long-only and 130-30 strategies benchmarked to MSCI ACWI from Feb 2007 – Mar 2022. This is meant to be an educational illustrative example and is not intended to represent investment returns generated by an actual portfolio. Hypothetical results do not represent actual trading or an actual account or reflect transaction costs or advisory fees. Reference to the benchmark is for comparative purposes only. Hypothetical results are not indicative of actual future results. Every investment program has an opportunity for loss as well as profit. Additional information about how the hypothetical portfolios were constructed is available upon request.
In the former case, the 1.6x-levered baseline provides a loose anchor for our expectations of 130-30 active performance, since both of these portfolios have similarly amplified exposure to the alpha model. To the extent that the extension implementation succeeds in producing even more than 1.6x the ex-ante alpha, we would expect it to have proportionately greater sensitivity to a breakdown in realized forecast efficacy. But we can reasonably view such risk as a feature of an extension—the very definition of achieving “high conviction”—rather than a bug.
What gives some investors pause, however, is concern that the short side of the extension portfolio creates risk of disproportionate loss (relative to the overall amplification of exposure to the alpha model). An archetypal example would be a “momentum crash” where trend-based signals are whipsawed particularly severely on the short-side by a quick shift in sentiment that causes previously weak stocks to suddenly rebound.
Several mechanisms can help to limit such vulnerability, however. A principal one is the maintenance of signal diversification on the short side of the portfolio to curb exposure to episodes like momentum crashes, junk rallies, or speculative froth that might drive asymmetric underperformance from one signal group. Indeed, in the case study, Figure 8 shows that the short-side of the hypothetical 130-30 is similarly well-balanced in terms of alpha drivers compared to both the extension’s long-side and the long-only baseline. Nuanced signal design can also mitigate the risk, for example by precisely isolating peer-relative stock mispricings and neutralizing unintended market or industry exposures that can exacerbate vulnerability to thematic market moves.8
Figure 8: Alpha Shares—Hypothetical Global 130-30 Strategy and Comparable Long-Only Baseline
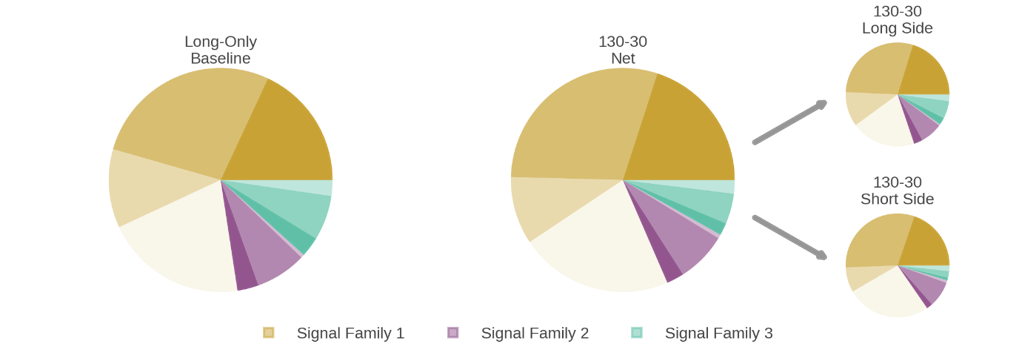
Source: Acadian. Hypothetical portfolios based on Global long-only and 130-30 strategies benchmarked to MSCI ACWI from Feb 2007 – Mar 2022. This is meant to be an educational illustrative example and is not intended to represent investment returns generated by an actual portfolio. Hypothetical results do not represent actual trading or an actual account or reflect transaction costs or advisory fees. Reference to the benchmark is for comparative purposes only. Hypothetical results are not indicative of actual future results. Every investment program has an opportunity for loss as well as profit. Additional information about how the hypothetical portfolios were constructed is available upon request.
A related concern associated with a breakdown of forecasting efficacy is crowding, i.e., this is the risk that a variety of seemingly unrelated signals might simultaneously and acutely underperform if many levered long-short systematic strategies concurrently unwind shared positions. During the 2007 “quant crisis,” in fact, struggles of many newly launched systematic 130-30 strategies were attributed to a wave of forced deleveraging by market-neutral quant funds.9
Nearly a generation later, however, conditions that prompted the quant crisis have changed a great deal. The marketplace is not now being inundated by a rush of rudimentary yet highly-levered long-short quant strategies nor is the ability to maintain a high degree of fund leverage taken for granted. Moreover, managers have developed mechanisms to mitigate crowding risk, including weighting signal exposures based on the health of the active opportunity set.
In the case of a shock to a risk factor, like size, our expectation of the performance impact on the hypothetical 130-30 strategy is anchored by the unlevered long-only baseline. That’s because in constructing both of these portfolios, we have imposed identical limits on many key risk exposures.
Nevertheless, an extension strategy that has been so specified still could be vulnerable to disproportionate underperformance if short-side risk is misestimated or crudely controlled. One illustrative example would involve a 130-30 strategy that has an overall portfolio beta of one but which is, nevertheless, unintentionally materially underweight the highest beta stocks. With such positioning, the extension could materially underperform in an intense speculative rally. Methods of mitigating such risk include applying nuanced measures of risk-factor exposures at the stock level and multifaceted controls on aggregate portfolio exposure. A second example would involve divergent performance of long and short holdings that normally provide naturally offsetting sensitivity to a risk factor. While imposing separate limits on long-side and short-side exposures represents one way to avoid such basis risk, managers have less restrictive options that may better maintain flexibility for alpha generation.
Conclusion
Systematic extension strategies are an underappreciated tool for asset owners seeking higher active returns. Relative to long-only portfolios, they can provide broader, deeper, and more precise exposure to a manager’s most attractive forecasts. While some investors have lingering concerns about risks associated with shorting, relaxing the long-only constraint increases flexibility in managing portfolio exposures. Moreover, relative to other approaches to high conviction active investing, which may rely on low-breadth bets, deliberately sacrifice diversification, or mask economic risk, systematic extensions are a highly disciplined approach to achieving the objective.
Additional DisclosuresFigure 1 eVestment Disclosure: eVestment Alliance, LLC and its affiliated entities (collectively, “eVestment”) collect information directly from investment management firms and other sources believed to be reliable, however, eVestment does not guarantee or warrant the accuracy, timeliness, or completeness of the information provided and is not responsible for any errors or omissions. Performance results may be provided with additional disclosures available on eVestment’s systems and other important considerations such as fees that may be applicable. Not for general distribution and limited distribution may only be made pursuant to client’s agreement terms. * All categories not necessarily included, Totals may not equal 100%. Copyright 2012-2023 eVestment Alliance, LLC. All Rights Reserved.
Don't miss the next Acadian Insight
Get our latest thought leadership delivered to your inbox