Systematic 130/30: A Better Path to High Conviction
Key Takeaways
- Short extension strategies such as 130/30 are a natural means to increase forecast (alpha) model exposure without directly increasing market risk; the long-only constraint is arguably the most detrimental to an investment manager’s information ratio (IR).
- 130/30 strategies empower managers to exploit negative—and even some otherwise inaccessible positive— return forecasts.
- Systematic 130/30 approaches have matured. Lessons learned from the GFC have informed development of richer approaches to managing risks associated with leverage and heightened forecast model exposure.
Table of contents
Introduction
130/30 and other short extension strategies emerged prior to the global financial crisis. Their motivation was intuitive and elegant: allow your manager to take limited short positions in an effort to improve returns while maintaining full market exposure. This concept emerged during a wave of financial product development, when equity market neutral and other alternative strategies gained broad acceptance. Investors were seeking new opportunities from markets that seemed unlikely to deliver the upside of the late 1990s.
More than a decade later, investors face considerable pressure to increase absolute returns in a prolonged environment of generationally low real yields. This has prompted a sharp increase in risk tolerance.1 In the equity domain, the search for returns has contributed to the popularization of concentrated fundamental strategies, despite the attendant increase in idiosyncratic risk and substantial potential to disappoint.
We believe that systematic 130/30 strategies represent a more prudent, typically well-diversified, means to achieve the objective. They represent an especially high-conviction form of quantitative active investing.
Benefits of Relaxing the "Long-Only" Constraint
Potential benefits of a 130/30 approach extend beyond mere leverage. Simply leveraging a long-only portfolio will increase expected returns, but it will also proportionately increase total risk, leaving the portfolio’s information ratio (IR), i.e., excess return per unit risk taken, unchanged.2 130/30 portfolios are more efficient implementations than a long-only approach, in the sense that they provide greater forecast model exposure per unit of risk.
Short extension strategies seek to improve IRs in two principal ways:
1. Roughly doubles the number of usable forecasts
Long-only strategies tied to broad market benchmark indices do not allow the full expression of views on stocks that are likely to underperform. Each stock’s weight reflects the maximum amount that a long-only manager can underweight the security, and weights may be quite small. In the S&P 500, for example, fully 10% of the stocks have a benchmark weight of less than 0.036%, a common occurrence in popular benchmarks (see Figure 1a). The impact of this limit on underweighting will be exacerbated if a manager has particularly strong negative forecasts, a tendency exemplified in the histogram of Acadian alpha forecasts shown in Figure 1b. Long-only portfolios may only capture half of a manager’s alpha forecasts and perhaps omit the highest-conviction signals.
2. Improves access to alpha in small-caps
We believe that small-cap stocks offer greater alpha generation potential because they are less efficiently priced; they have poorer information environments and are more difficult to trade. Indeed, Figure 2 shows that stocks associated with Acadian’s most extreme alpha forecasts, both positive and negative, tend to be in small-cap names. A long-only manager with this profile may have difficulty gaining full exposure even to its most positive forecasts, because doing so would likely entail material exposure to a small-cap risk factor. A 130/30 implementation, in contrast, allows the manager to take better advantage of the positive small-cap forecasts since it can short a position in small-caps with negative forecasts to hedge the size risk. This not only applies to market capitalization exposure, but also currency, country, industry, and other sources of risk as well.
Figure 1

Figure 2
 Source: Acadian calculations. As of December 31, 2017. Provided for illustrative purposes only. The chart depicts our forecast distribution process based on proprietary models. There can be no assurance that the forecasts will be achieved.
Measuring the Benefit
Intuitively, greater ability to capture negative and small-cap forecasts should increase a short extension manager’s IR relative to long-only. To confirm, we appeal to a modified version of Grinold and Kahn’s fundamental law of active management. It states that the reward per unit risk (IR) an investor receives is the product of the manager’s forecasting skill (IC), the number of independent bets the manager takes (√𝑁),3 and what’s known as the transfer Coefficient (TC).4 The transfer coefficient represents the manager’s ability to translate forecasting insights into the portfolio.
The transfer coefficient provides direct means to assess the ex-ante reduction in risk-adjusted performance, IR, due to portfolio constraints. Transfer coefficients range from 0, for a portfolio constrained to mimic the benchmark, to 1, for a completely unconstrained portfolio.5 In practice, transfer coefficients are meaningfully less than 1 due to various constraints imposed during portfolio construction, e.g., risk controls.
130/30 strategies directly improve the transfer coefficient. The ability to short empowers the manager to express views on both over and underperformance, irrespective of a stock’s benchmark weight. Table 1 shows that the hypothetical 130/30 strategy has a 27% larger transfer coefficient than the long-only portfolio, which implies a 27% larger ex-ante IR. That is because IR is directly proportional to the transfer coefficient by the revised fundamental law of active management.
This improvement derives solely from relaxing the long-only constraint. It requires no change to the alpha model – neither improved efficacy of existing signals nor the addition of new ones.6 As such, releasing the long-only constraint may be the most straightforward and efficient way to extract additional alpha—it reflects the more complete application of the already existing model. The benefit is akin to installing a turbo charger rather than inventing an entirely new engine.
Table 1

Hypothetical portfolios constructed to optimize alpha7 subject to a 10% active risk constraint, Beta of 1 to the MSCI World Index and 4% monthly turnover. For illustrative and educational purposes only. This is not intended to represent investment returns generated by an actual portfolio. They do not represent trading or an actual account, but were achieved by means of using Acadian’s alpha models and securities from the MSCI World Index for the period Jan 31, 2010 to Dec 31, 2017. Results reflect transactions costs, but they do not reflect other potential costs. Hypothetical results are not indicative of actual future results. Every investment program has the opportunity for loss as well as profit. Index Source: MSCI Copyright MSCI 2018. All Rights Reserved. Unpublished. PROPRIETARY TO MSCI.
Operational Challenges
Although the prior exercise suggests that short extension strategies should increase ex-ante expected performance for any manager with non-zero forecasting ability, they entail operational and risk management challenges that, without focused attention and experience, may more than offset potential gains.
First, shorting securities can be operationally intensive. Borrowing costs vary both in time and by prime broker. Negotiating rates is commonplace and time consuming. In addition to current borrow rates, a manager should also have forecasts of future borrow availability and borrow costs, since all are important inputs for the portfolio construction process.
Implementation challenges in shorting include margin calls and regulatory risks, an example of the latter being the re-imposition of uptick rules in the U.S. during the global financial crisis. Outside of developed markets, locating shares available to short may not be straightforward. In fact, short selling is restricted or difficult in many markets, requiring the use of equity swaps and other alternatives. In Taiwan, for example, shorting is permitted, but shares are frequently recalled around company announcements.
Operational errors when shorting may be particularly expensive, between potential fines, forced unwinds and undeployed capital. Locating shares or swaps, managing fees, and navigating recalls requires an experienced team, particularly for portfolios that span multiple markets.
Risk Management Considerations
Short extension approaches present risk management challenges. First, with respect to market exposure, offsetting long and short $30 dollar notional positions does not ensure beta neutrality, an added wrinkle in portfolio construction.8 What’s more, the betas and correlations of the stocks in the portfolio should be monitored and reevaluated as market conditions change. Consequently, short extension strategies require more hands-on management of risk than their long-only counterparts.
Second, a 130/30 portfolio has both average market risk and greater exposure to a manager’s alpha model, 1.6 times, than a long-only strategy.9 This multiplier benefits active returns when alpha forecasts prove accurate, but it exacerbates underperformance if the alpha model breaks down. The “junk rally” of 2009 represents a case in point. Following the severe market decline in 2008, 2009 brought a nearly indiscriminate rebound. In fact, securities with the least attractive fundamentals seemed to perform the best, as shown in Figure 3. A typical value investor (quantitative or otherwise), likely would have experienced severe underperformance during this period, and a typical 130/30 portfolio fared even worse (Figure 3). Since 130/30 portfolios have full market exposure (beta of 1), alpha forecast failures during down markets are particularly painful. As a result, many 130/30 strategies had severe negative returns during the GFC.
Figure 3
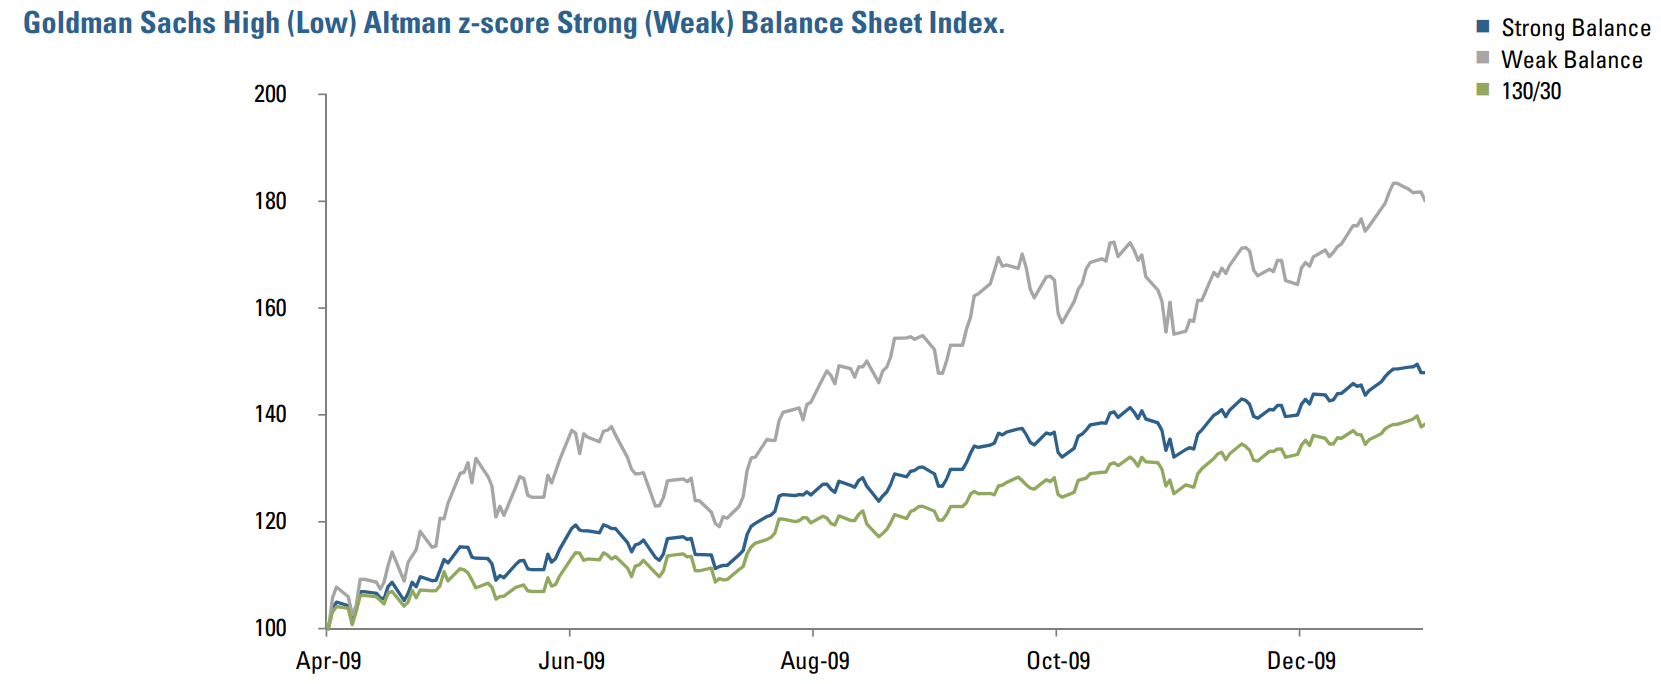
Source: Bloomberg. Values normalized to 100 at start of period. Hypothetical 130/30 portfolio constructed as 1.3x Strong Bal – 0.3x Weak Bal. For illustrative purposes only. Not based on actual trading or an actual account. Past results not indicative of future results. Every investment program has an opportunity for loss as well as profits.
This highlights the risk of factor concentration and the attendant importance of prudent portfolio constraints and risk management. Arguably, the most important adaptation following the GFC has been the use of richer measures of risk. While many GFC-era managers focused on estimates of portfolio volatility and beta, sophisticated managers now seek to control varied sources of risk in a portfolio. Examples include industry, region, and market capitalization constraints as well as volume-based position caps to limit liquidity risk. At Acadian, we also apply “dynamic asset bounds” that restrict active positions at the individual security level based on recent price action in the name.
We believe that systematic 130/30 strategies should employ a mix of uncorrelated factors in order to provide diversification benefits. However, factors and their payoffs vary over time. The behaviors of historically distinct factors may converge, especially during periods of stress. If not corrected, a single factor can effectively dominate the entire risk budget of a portfolio, and is tantamount to a reduction in breadth. Effective monitoring requires a sophisticated and dynamic risk model that accounts for evolving factor dynamics. The use of leverage makes this particularly important for short extension strategies.
Conclusion
Short extension strategies such as 130/30 may look especially appealing in the current investing climate. The past 10 years of central bank stimulus have caused a reflation in asset prices. Valuations have risen, arguably increasing the opportunity set for managers who are able to short. As well, low dispersion has been a drag on active performance, which has led to investors to seek out high active risk strategies.
We believe that systematic 130/30 strategies offer prudent means to address both objectives. And they have matured. Many have 10-year track records, and some active quantitative mangers have invested in the expertise and capabilities to deal with the operational and risk management challenges associated with leverage and shorting. In the current environment, we believe investors should consider systematic short extension strategies, particularly as an alternative to concentrated approaches that sacrifice prudent diversification to achieve high active risk.
Endnotes
- Perhaps a telling example is Argentina’s recent successful issuance of a century bond, maturing in 2117, with a YTM of less than 8%—this from a country that has defaulted six times in the past 100 years, most recently in 2014. “The Rush for Argentina’s 100-year Bond Points to an Investment Bubble,” Financial Times, June 22, 2017.
- Ignoring financing and other costs.
- Breadth is proportional to independent forecasts and not necessarily the number of securities.
- IR = Transfer Coefficient x IC x √𝑁
- Strictly speaking, the TC can be negative if a portfolio is constrained to bet against alpha forecasts. However, such portfolios would be abandoned in favor of the benchmark.
- The former reflects improved IC, the latter increased breadth.
- Portfolio uses Acadian’s proprietary alpha model.
- For example, if security A has a beta of 1, while security B has a beta of 0.6, the beta of the resulting position would be 0.4, which is very much non-zero. This indicates residual market exposure.
- 1+ 0.3 (long extension) + 0.3 (short extension)
Hypothetical Legal Disclaimer
Acadian is providing hypothetical performance information for your review as we believe you have access to resources to independently analyze this information and have the financial expertise to understand the risks and limitations of the presentation of hypothetical performance. Please immediately advise if that is not the case.
Hypothetical performance results have many inherent limitations, some of which are described below. No representation is being made that any account will or is likely to achieve profits or losses similar to those shown. In fact, there are frequently sharp differences between hypothetical performance results and the actual performance results subsequently achieved by any particular trading program.
One of the limitations of hypothetical performance results is that they are generally prepared with the benefit of hindsight. In addition, hypothetical trading does not involve financial risk, and no hypothetical trading record can completely account for the impact of financial risk in actual trading. For example, the ability to withstand losses or to adhere to a particular trading program in spite of trading losses are material points which can also adversely affect actual trading results. There are numerous other factors related to the markets in general or to the implementation of any specific trading program which cannot be fully accounted for in the preparation of hypothetical performance results and all of which can adversely affect actual trading results.
Don't miss the next Acadian Insight
Get our latest thought leadership delivered to your inbox
Legal Disclaimer
These materials provided herein may contain material, non-public information within the meaning of the United States Federal Securities Laws with respect to Acadian Asset Management LLC, Acadian Asset Management Inc. and/or their respective subsidiaries and affiliated entities. The recipient of these materials agrees that it will not use any confidential information that may be contained herein to execute or recommend transactions in securities. The recipient further acknowledges that it is aware that United States Federal and State securities laws prohibit any person or entity who has material, non-public information about a publicly-traded company from purchasing or selling securities of such company, or from communicating such information to any other person or entity under circumstances in which it is reasonably foreseeable that such person or entity is likely to sell or purchase such securities.
Acadian provides this material as a general overview of the firm, our processes and our investment capabilities. It has been provided for informational purposes only. It does not constitute or form part of any offer to issue or sell, or any solicitation of any offer to subscribe or to purchase, shares, units or other interests in investments that may be referred to herein and must not be construed as investment or financial product advice. Acadian has not considered any reader's financial situation, objective or needs in providing the relevant information.
The value of investments may fall as well as rise and you may not get back your original investment. Past performance is not necessarily a guide to future performance or returns. Acadian has taken all reasonable care to ensure that the information contained in this material is accurate at the time of its distribution, no representation or warranty, express or implied, is made as to the accuracy, reliability or completeness of such information.
This material contains privileged and confidential information and is intended only for the recipient/s. Any distribution, reproduction or other use of this presentation by recipients is strictly prohibited. If you are not the intended recipient and this presentation has been sent or passed on to you in error, please contact us immediately. Confidentiality and privilege are not lost by this presentation having been sent or passed on to you in error.
Acadian’s quantitative investment process is supported by extensive proprietary computer code. Acadian’s researchers, software developers, and IT teams follow a structured design, development, testing, change control, and review processes during the development of its systems and the implementation within our investment process. These controls and their effectiveness are subject to regular internal reviews, at least annual independent review by our SOC1 auditor. However, despite these extensive controls it is possible that errors may occur in coding and within the investment process, as is the case with any complex software or data-driven model, and no guarantee or warranty can be provided that any quantitative investment model is completely free of errors. Any such errors could have a negative impact on investment results. We have in place control systems and processes which are intended to identify in a timely manner any such errors which would have a material impact on the investment process.
Acadian Asset Management LLC has wholly owned affiliates located in London, Singapore, and Sydney. Pursuant to the terms of service level agreements with each affiliate, employees of Acadian Asset Management LLC may provide certain services on behalf of each affiliate and employees of each affiliate may provide certain administrative services, including marketing and client service, on behalf of Acadian Asset Management LLC.
Acadian Asset Management LLC is registered as an investment adviser with the U.S. Securities and Exchange Commission. Registration of an investment adviser does not imply any level of skill or training.
Acadian Asset Management (Singapore) Pte Ltd, (Registration Number: 199902125D) is licensed by the Monetary Authority of Singapore. It is also registered as an investment adviser with the U.S. Securities and Exchange Commission.
Acadian Asset Management (Australia) Limited (ABN 41 114 200 127) is the holder of Australian financial services license number 291872 ("AFSL"). It is also registered as an investment adviser with the U.S. Securities and Exchange Commission. Under the terms of its AFSL, Acadian Asset Management (Australia) Limited is limited to providing the financial services under its license to wholesale clients only. This marketing material is not to be provided to retail clients.
Acadian Asset Management (UK) Limited is authorized and regulated by the Financial Conduct Authority ('the FCA') and is a limited liability company incorporated in England and Wales with company number 05644066. Acadian Asset Management (UK) Limited will only make this material available to Professional Clients and Eligible Counterparties as defined by the FCA under the Markets in Financial Instruments Directive, or to Qualified Investors in Switzerland as defined in the Collective Investment Schemes Act, as applicable.