Conflicts of Interest in U.S. Equity Order Routing: Hidden Costs to Asset Owners
Key Takeaways
- U.S. equity exchanges offer inducements, in the form of execution fee discounts or rebates, to attract flow from brokers and other member firms.
- Empirical evidence shows that brokers respond to exchange inducements, through “cost-sensitive order routing,” to the detriment of their customers, which include institutional investment managers and the asset owners they represent.
- The SEC recently proposed to ban a practice known as volume-based exchange pricing, which amplifies the inducements and, hence, exacerbates the conflict. In this note, we argue that conflicts of interest in execution warrant broader scrutiny.
Table of contents
U.S. equity market structure is complex and fragmented. One consequence of this tangled plumbing is that it fosters conflicts of interest when brokers place stock orders on behalf of their customers. In this paper, we examine one such conflict that involves a controversial practice known as volume-based exchange pricing, whereby stock exchanges offer incentives, in the form of lower execution fees or higher rebates (positive payments), to member firms, including brokers, that trade more on their venues.1
In the U.S., broker-dealers have traditionally absorbed execution fees and rebates rather than passing them through to the investors whose orders they represent in the market. As a result, intermediaries’ routing decisions may be dictated by their profit motive at the expense of their customers’ best interests. Volume-based pricing significantly exacerbates this conflict, by amplifying brokers’ financial incentives. As a result, the SEC recently proposed to ban the practice. In this paper, we highlight the impact of cost-sensitive order routing for investors in U.S. equities. We argue that the proposed ban on volume-based pricing, while a step in the right direction, does not go far enough to combat distortions in brokers’ routing decisions that persist under the current system. Even though order routing may seem a dry and distant topic to asset owners, we would encourage them to take note, because it directly affects the performance of the equity strategies in which they invest.
Exchanges’ Inducements for Order Flow
U.S. stock exchanges are for-profit entities that generate revenue from brokers and other member firms2 through three types of fees – connectivity, market data, and transaction-based.3 While an exchange’s connectivity and market data revenue does not vary with member firms’ activity, its transaction-based revenue varies with the volume that the exchange can attract and execute.
Transaction-based revenue derives from executions on the exchange by member firms, including those of brokers representing customer orders. Generally speaking, for every completed transaction, a member either pays a fee to or receives a rebate from the exchange. Fees and rebates are venue specific. Each exchange chooses its own transaction-based pricing model and sets an associated fee/rebate schedule.
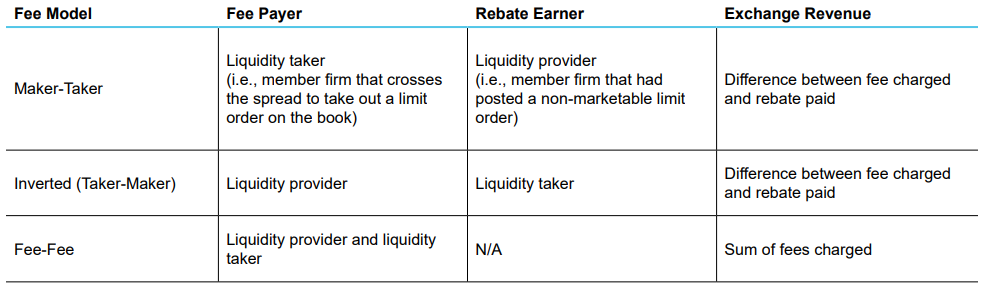
Across U.S. stock exchanges, there are three pricing models: maker-taker, inverted (taker-maker), and fee-fee, which differ in terms of whether the liquidity taker or liquidity provider in a transaction pays a fee or earns a rebate. The following table summarizes key differences.
To maximize their profit potential, some exchange operators preside over multiple exchange venues with different pricing models. NYSE operates 5 (3 maker-taker, 1 inverted, 1 fee-fee), Cboe operates 4 (2 maker-taker and 2 inverted), and Nasdaq operates 3 (2 maker-taker and 1 inverted). Diversifying across pricing models allows the parent company to use rebates to attract both liquidity-providing and liquidity-removing orders.
In attracting order flow, volume-based pricing has become an important lever for exchanges.4 Volume-based pricing incentivizes member firms to route orders to an exchange by lowering fees charged or increasing rebates paid if their total monthly volume of executions exceeds a preset exchange-specific threshold (a volume “tier”). An example clarifies. Nasdaq pays a base-level rebate rate of $0.0018 per share for posted limit orders that result in an execution; however, if a broker executes enough liquidity-providing client orders on Nasdaq to meet their highest volume tier, that broker would receive an enhanced rebate of $0.00305 per share for all rebate-eligible transactions executed over the course of the prior month, a 70% increase from the base rate.5
As a result, the fee that a broker would be charged, or the rebate that it would earn, to execute a customer’s buy or sell order may vary dramatically across exchanges, and pricing has become bewilderingly complex.
Impact on Broker Behavior
In trading on behalf of an institutional customer, a broker may choose to execute by posting a limit order, i.e., providing liquidity, or by routing a market order, i.e., removing liquidity. The decision on how and where to execute reflects multiple influences. One of them is maximization of rebate income from the exchanges. That’s because brokers are the typical beneficiaries of any economic incentive offered by the exchanges in the form of rebates or reduced fees. In most cases, brokers do not (directly) pass them on to their customers who typically pay fixed commission rates for execution services.
The stakes involved in brokers’ routing decisions are material. Brokers trade hundreds of millions of shares per day on behalf of commission-paying clients. With the average institutional commission rate to trade U.S stocks currently hovering between $0.0050 - $0.01 per share, rebate rates and fees, both typically in the range of $0.0020 - $0.0030 per share, can represent a significant boost to or drag on a broker’s revenue.
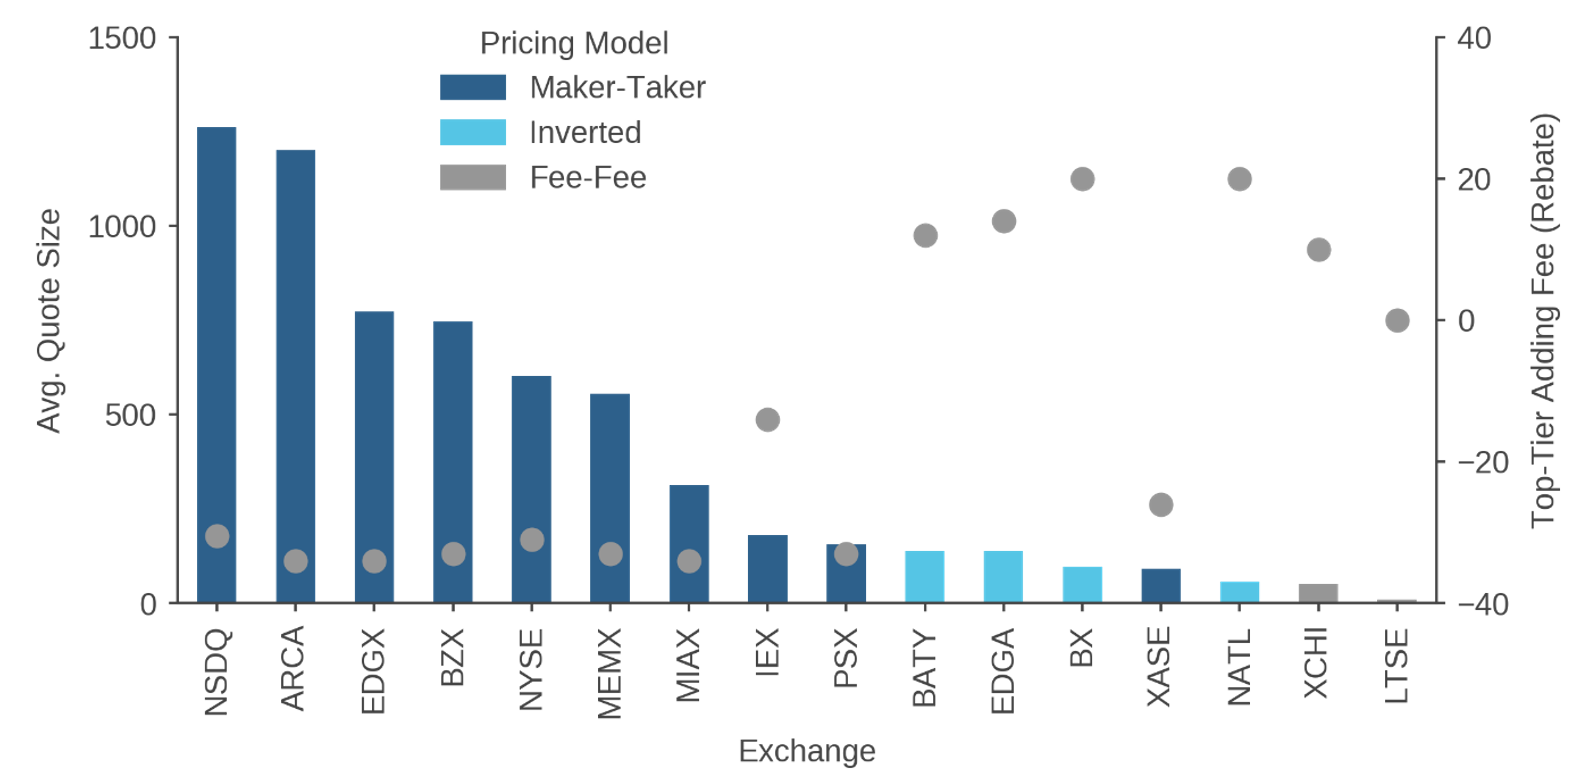
Given those economics, it is hardly surprising that empirical evidence shows that fee-based incentives affect member firms’ routing decisions. Figure 1 on the first page, for example, shows that member firms prefer to post liquidity-providing limit orders on maker-taker venues where they can earn rebates. Average quote sizes resting on such exchanges (dark blue bars) are much larger than on inverted and fee-fee exchanges (aqua and gray bars) where posting incurs a fee.
Figure 1: Evidence of Cost-Sensitive Order Routing—Liquidity Providing Limit Orders by Exchange
Average Quote Size Versus Top Tier Lit adding Fee (Rebate); Jan 1 – Jun 20, 2024
We also observe cost-sensitive behavior for liquidity-removing orders. Evidence is presented in Figure 2, which summarizes an analysis from BestEx Research.6 For a given exchange identified at the top of a column, the value in each cell captures the percentage of instances that it received and executed, i.e., “won,” a spread-crossing order while displaying a quote at the same inside price (either bid or offer) as the exchange indicated in each row.
Figure 2: BestEx Research “WinMatrix”
Percentage of instances in which exchange at top of column received and executed (“won”) a spread-crossing order versus exchange in each row when both were quoting at inside price
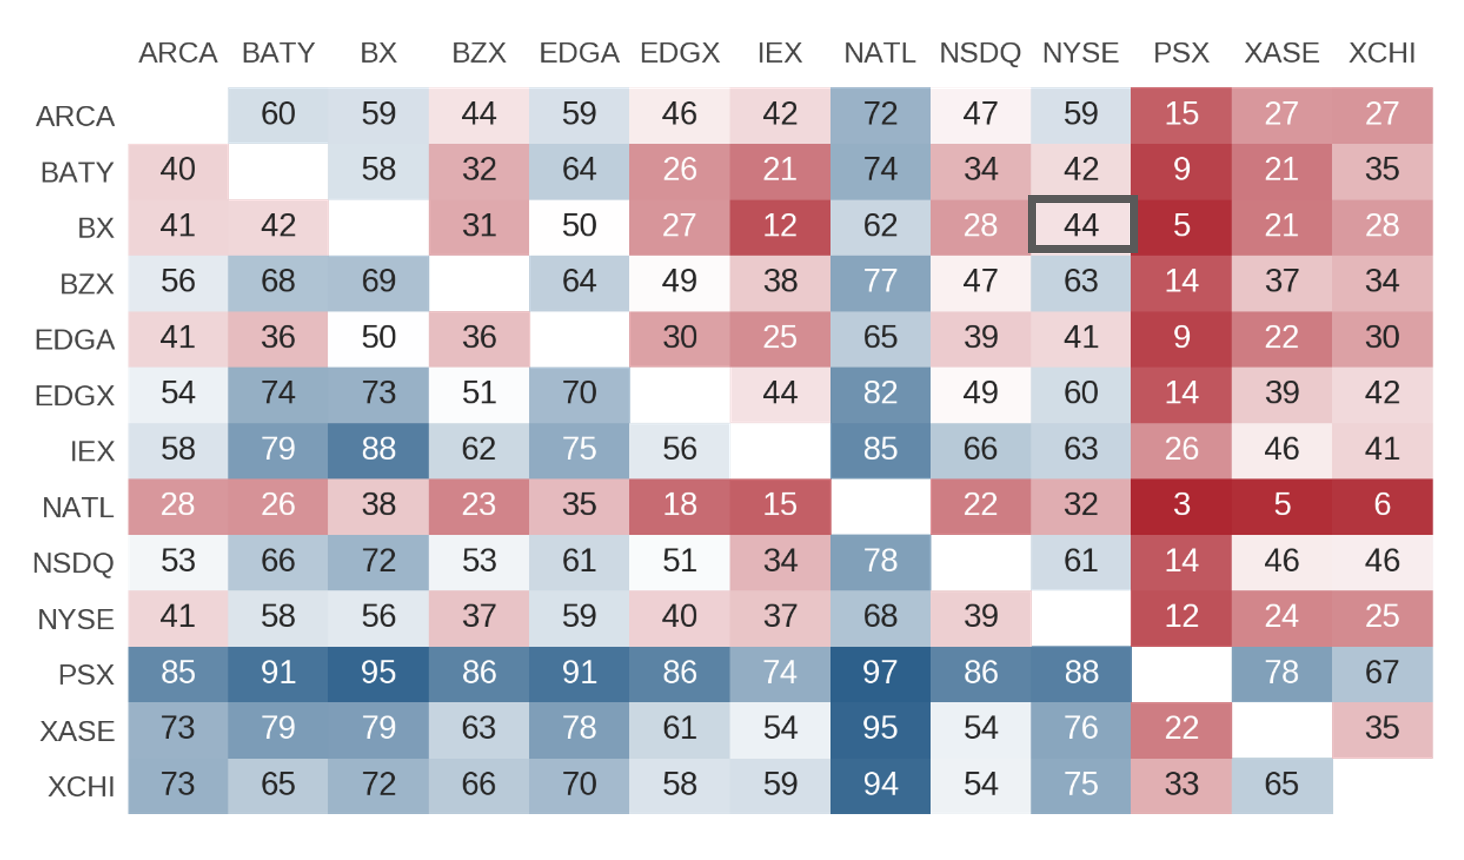
Representative of the key result, the box with the bold outline indicates that NYSE, a maker-taker exchange that charges a fee for removing liquidity, won a liquidity-removing order only 44% of the time when it and the Nasdaq BX, an inverted exchange that pays a rebate for taking liquidity, were quoting at the inside price. Nasdaq BX won the other 56%. To generalize, scanning the matrix reveals that the four inverted exchanges, BX, BATY, EDGA, and NATL, won liquidity taking orders at least 56% of the time when displaying a quote at the same price as any maker-taker or fee-fee venue. Moreover, the venue with the highest overall win rate, NATL (NYSE National), pays the highest rebate for liquidity-removing orders among all the inverted exchanges. Academic research corroborates these results.7
This evidence indicates that exchange incentives have their intended effect in influencing flows. Trading firms, including brokers representing agency clients, prefer to trade on venues that pay them rebates. The key question for investment managers and asset owners, whose portfolios the brokers are trading, is whether cost-sensitive routing is harming their interests.
Cost to Investment Managers and their Clients
Although brokerage firms are profit-maximizing businesses, they are also regulated entities with a best-execution obligation. In managing an order received from a client, therefore, the broker has an obligation to route the trade in a manner that reduces the client’s implicit execution cost, i.e., the market impact.8 But U.S. market structure has (d)evolved into a state in which agency brokers often are forced to choose between their clients’ best interests and their own bottom lines. Unfortunately, research has shown that cost-sensitive order routing has damaged several measures of execution quality.
For example, there is evidence of greater adverse selection associated with cost-sensitive order routing. A commonly used measure of adverse selection is known as a trade markout, which is simply the difference between the execution price of the stock and the subsequent midpoint price after a fixed amount of time has elapsed, e.g., one second. In the case of a buy, a negative one-second markout would indicate that one second after an execution, the price of the stock had ticked lower, suggesting that the broker could have achieved a more favorable price for the customer had it waited to execute the purchase. A positive markout would imply that, one second after the execution, the midpoint price remained higher than the execution price, to the customer’s benefit.
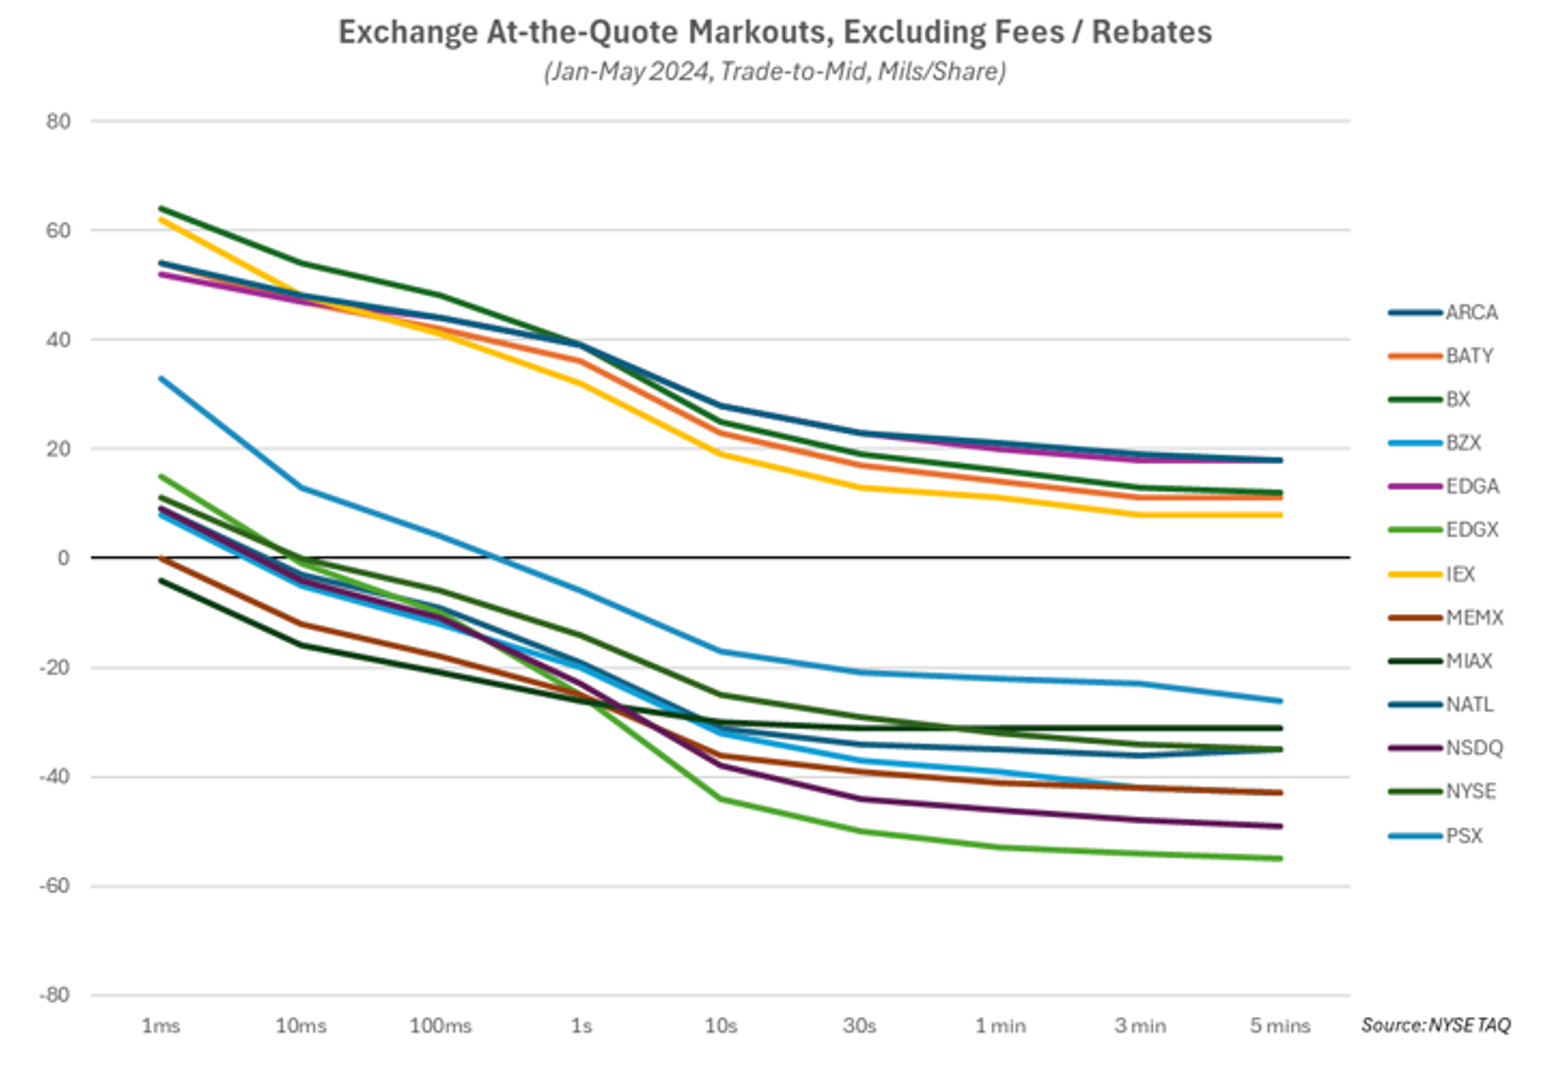
Research suggests that limit orders posted on maker-taker exchanges, which offer rebates for doing so, result in the least favorable markouts, whereas similar orders placed on inverted and fee-fee exchanges result in the most favorable. Figure 3, from IEX Group, provides evidence.9 The various traces record average markouts across multiple time intervals for a subset of exchanges. Markouts on maker-taker exchanges are significantly lower than those exhibited on inverted venues (BATY, BX, EDGA, NATL) and IEX, as large as $0.0040 to $0.0050 per share. Said differently, immediately after receiving a liquidity-providing execution on a maker-taker exchange, the end investor is up to half a penny worse off than it would have been had it received the same fill on an inverted exchange or on IEX10, strong evidence of greater adverse selection.11
Figure 3: Trade Markouts on Non-Marketable Limit Orders by Exchange
Exchange At-the-Quote Markouts, Excluding Fees/Rebates (Jan-May 2024, Trade-to-Mid, Mils/Share)
There is also evidence of the conflict of interest in time-to-fill and fill-rate metrics of execution quality. Time-to-fill measures how long a liquidity-providing order remains on a limit order book before a liquidity-removing order crosses the spread to interact with it. Shorter is generally better, because it minimizes market variation and risk of information leakage about the investor’s trading intentions between order placement and execution. Fill rate simply refers to the proportion of an order that gets executed, higher being better.
Figure 2 showed that among venues displaying identical prices, liquidity removers typically take from the one that offers the highest rebate/lowest fee. It should come as no surprise then that for liquidity providing orders, times-to-fill are longer (worse) on maker-taker exchanges than on inverted and fee-fee venues. Similarly, limit order fill rates on inverted and fee-fee venues are higher than on maker-taker exchanges.12
The foregoing evidence of cost-sensitive routing’s impact on execution quality relates to executions of individual (“child orders”) routed to an exchange. While helpful, it does not provide a clear sense of the impact on the execution quality of the large-scale orders that institutional investors generally send to their agency brokers. To minimize price impact, brokers often trade those larger “parent orders” through their algorithmic strategies, which break them down into smaller child orders that get routed to exchanges over some time horizon. Absent specific instructions from its client, the broker maintains discretion over the algorithm’s choice of trading venue and order type for each child order submission.
At the parent level, there is also evidence that cost-sensitive routing harms performance. Clearpool Group, an agency broker-dealer specializing in electronic trading solutions and execution transparency, found that a fee-sensitive router exhibited worse performance versus a VWAP benchmark as compared to a fee-agnostic router, while a blended router that balanced trade-offs between fee-sensitive and fee-agnostic methods landed in the middle.13
A Flawed Counterargument
Defenders of the status quo have argued that volume-based pricing is commonplace in most industries and that the public equity marketplace should be no different. In a statement issued shortly after the proposed ban on volume-based exchange pricing was made public, for example, SEC Commissioner Hester Peirce pointed out that warehouse stores offer bulk discounts.14
The flaw in Peirce’s analogy, however, is that it only applies if the end-user is also the beneficiary of the price discount. As she noted, the warehouse stores cut annual checks to their customers based on how much they spend. But this does not hold true in the case of volume-based exchange pricing or in the broader context of inducements paid by exchanges to attract broker flow. In both cases, the end users – including institutional asset owners – pay the non-discounted price of the stocks they purchase in the market, while the intermediary broker pockets the rebates (discounts). Moreover, published research indicates that the (non-discounted) prices that investors receive as a result of their executing brokers’ cost-sensitive routing decisions are worse than if the brokers weren’t routing to maximize rebate payments.
Conclusion
In the convoluted U.S. equity market structure, payments of rebates that exchanges offer to attract flow create a blatant conflict of interest for member firms trading on behalf of agency clients. Volume-based exchange pricing exacerbates the conflict, but it is not the root cause. Therefore, while we are supportive of the SEC’s proposal to ban volume-based pricing, we believe that conflicts associated with cost-sensitive order routing warrant more expansive regulatory scrutiny. While the issue has drawn attention from execution staff at institutional investment managers, asset owners should also take note, in light of the potential harm to the performance of their portfolios.
Endnotes
- The rebates represent on-exchange “payment for order flow,” a controversial practice aimed at influencing the disposition of orders from retail investors in the U.S. that regulators have closely scrutinized in recent years.
- An exchange “member firm” refers to any firm that connects to and executes on the exchange. In addition to brokers, they include market makers and automated trading firms.
- The two listing exchanges, NYSE and Nasdaq, also collect listing fees. Best execution obligations essentially force brokers to connect to every exchange and consume their trade and quote data products.
- Fourteen of the sixteen U.S. equity exchanges have offered some flavor of volume-based pricing for many years. The IEX Exchange and NYSE Chicago are the two exceptions.
- https://www.nasdaqtrader.com/Trader.aspx?id=PriceListTrading2
- See BestEx Research, Hitesh Mittal, Kathryn Berkow, and Johnson Zachariah. “Queue-jumping & Strategic Limit Order Routing” (2020).
- In 2015, researchers at the University of Notre Dame conducted similar horseraces between exchange venues that offer different levels of “take fees” – the fees (or rebates) associated with crossing the spread to execute. The exchange in each horserace with the lowest take-fee (highest take-rebate) received a spread-crossing order a greater percentage of the time. Further, as the fee differential between each venue in the horserace widened, the win rate of the lower fee (higher rebate) venue increased. Battalio, Robert, Shane Corwin, Robert Jennings, Can Brokers Have It All? On the Relation between Make-Take Fees and Limit Order Execution Quality, 2015.
- The explicit portion of the execution cost, commission, is fixed in advance, through negotiation, at the outset of the broker-manager trading relationship. The explicit portion of the execution cost, commission, is fixed in advance, through negotiation, at the outset of the broker-manager trading relationship.
- The figure is an updated version of an exhibit found in Wah, Elaine, Stan Feldman, Francis Chung, Allison Bishop, Dan Aisen, A Comparison of Execution Quality across U.S. Stock Exchanges, 2017.
- Take fees on IEX are significantly lower than those on other maker-taker exchanges.
- Wah et al., p. 27.
- See Sofianos, George and Ali Yousefi, Smart routing: Good fills, bad fills and venue toxicity, Goldman Sachs Equity Execution Strategies Street Smart, 2010. The authors found that times-to-fill were lowest and fill rates were highest for limit orders posted on inverted venues as compared to higher fee (to take) maker-taker venues.
- Specifically, Clearpool compared parent-level trading performance across three different routing strategies to select execution venue while applying the same underlying “VWAP” (volume weighted average price) algorithm trading methodology to determine the timing, size, and price of each child. For their experiment, Clearpool created three different routing profiles: fee sensitive—attempts to minimize execution fees/maximize rebates; fee agnostic—attempts to maximize execution performance (minimize implicit cost); blended—attempts to balance the trade-offs between fee sensitive and fee agnostic routing. See https://info.clearpoolgroup.com/blog/clear-perspective-choosing-the-appropriate-incentive-to-trade-matters.
- “Economies of scale trigger discounts in almost every industry,” she explained, “why should similar discounts be unavailable in this industry?” https://www.sec.gov/news/ statement/statement-peirce-proposed-volume-based-exchange-transaction-pricing-nms-10-18-2023
Legal Disclaimer
These materials provided herein may contain material, non-public information within the meaning of the United States Federal Securities Laws with respect to Acadian Asset Management LLC, Acadian Asset Management Inc. and/or their respective subsidiaries and affiliated entities. The recipient of these materials agrees that it will not use any confidential information that may be contained herein to execute or recommend transactions in securities. The recipient further acknowledges that it is aware that United States Federal and State securities laws prohibit any person or entity who has material, non-public information about a publicly-traded company from purchasing or selling securities of such company, or from communicating such information to any other person or entity under circumstances in which it is reasonably foreseeable that such person or entity is likely to sell or purchase such securities.
Acadian provides this material as a general overview of the firm, our processes and our investment capabilities. It has been provided for informational purposes only. It does not constitute or form part of any offer to issue or sell, or any solicitation of any offer to subscribe or to purchase, shares, units or other interests in investments that may be referred to herein and must not be construed as investment or financial product advice. Acadian has not considered any reader's financial situation, objective or needs in providing the relevant information.
The value of investments may fall as well as rise and you may not get back your original investment. Past performance is not necessarily a guide to future performance or returns. Acadian has taken all reasonable care to ensure that the information contained in this material is accurate at the time of its distribution, no representation or warranty, express or implied, is made as to the accuracy, reliability or completeness of such information.
This material contains privileged and confidential information and is intended only for the recipient/s. Any distribution, reproduction or other use of this presentation by recipients is strictly prohibited. If you are not the intended recipient and this presentation has been sent or passed on to you in error, please contact us immediately. Confidentiality and privilege are not lost by this presentation having been sent or passed on to you in error.
Acadian’s quantitative investment process is supported by extensive proprietary computer code. Acadian’s researchers, software developers, and IT teams follow a structured design, development, testing, change control, and review processes during the development of its systems and the implementation within our investment process. These controls and their effectiveness are subject to regular internal reviews, at least annual independent review by our SOC1 auditor. However, despite these extensive controls it is possible that errors may occur in coding and within the investment process, as is the case with any complex software or data-driven model, and no guarantee or warranty can be provided that any quantitative investment model is completely free of errors. Any such errors could have a negative impact on investment results. We have in place control systems and processes which are intended to identify in a timely manner any such errors which would have a material impact on the investment process.
Acadian Asset Management LLC has wholly owned affiliates located in London, Singapore, and Sydney. Pursuant to the terms of service level agreements with each affiliate, employees of Acadian Asset Management LLC may provide certain services on behalf of each affiliate and employees of each affiliate may provide certain administrative services, including marketing and client service, on behalf of Acadian Asset Management LLC.
Acadian Asset Management LLC is registered as an investment adviser with the U.S. Securities and Exchange Commission. Registration of an investment adviser does not imply any level of skill or training.
Acadian Asset Management (Singapore) Pte Ltd, (Registration Number: 199902125D) is licensed by the Monetary Authority of Singapore. It is also registered as an investment adviser with the U.S. Securities and Exchange Commission.
Acadian Asset Management (Australia) Limited (ABN 41 114 200 127) is the holder of Australian financial services license number 291872 ("AFSL"). It is also registered as an investment adviser with the U.S. Securities and Exchange Commission. Under the terms of its AFSL, Acadian Asset Management (Australia) Limited is limited to providing the financial services under its license to wholesale clients only. This marketing material is not to be provided to retail clients.
Acadian Asset Management (UK) Limited is authorized and regulated by the Financial Conduct Authority ('the FCA') and is a limited liability company incorporated in England and Wales with company number 05644066. Acadian Asset Management (UK) Limited will only make this material available to Professional Clients and Eligible Counterparties as defined by the FCA under the Markets in Financial Instruments Directive, or to Qualified Investors in Switzerland as defined in the Collective Investment Schemes Act, as applicable.
Biography
