U.S. Small-Cap Performance: Relatively Bad but Absolutely Fine
Key Takeaways
- While conventional wisdom holds that U.S. small-cap stocks have had a poor decade, their risk-adjusted performance has been consistent with long-term history.
- Looking forward, we find little evidence to support two often-cited sources of concern regarding the outlook for U.S. small caps: interest rate exposure and deterioration in quality.
- The case for an allocation to active U.S. small caps remains strong. Even modest skill in this relatively inefficient market segment would be consistent with an active allocation in excess of cap weight.
Table of contents
For many investors, the past several years have been a frustrating time to own U.S. small-cap stocks. To capture just how bad their performance has been, consider the key U.S. small-cap benchmark, the Russell 2000. For the decade ending in April 2024, the index’s annualized Sharpe Ratio was 0.38. That may not sound horrendous, but by comparison consider a heyday of small caps, from September 1998 through August 2008, when the Russell 2000 beat the Russell 1000 by a remarkable 82%. During that period, the Russell 2000’s Sharpe Ratio was … author double checks notes … 0.40—which is essentially the same as over the purportedly poor past ten years.
In fact, as Figure 1 shows, standalone Russell 2000 performance over the last decade was remarkably close to its longer-term Sharpe Ratio of 0.39 from 1995-present. Moreover, using data from a different source to look back nearly a century, U.S. stocks in the bottom 30% of market capitalization generated a Sharpe Ratio of 0.41, only modestly higher than the past 10-year data point of 0.37.1
Figure 1: Risk-Adjusted Performance of U.S. Small-Cap Stocks
Sharpe Ratios estimated over rolling 10-year windows
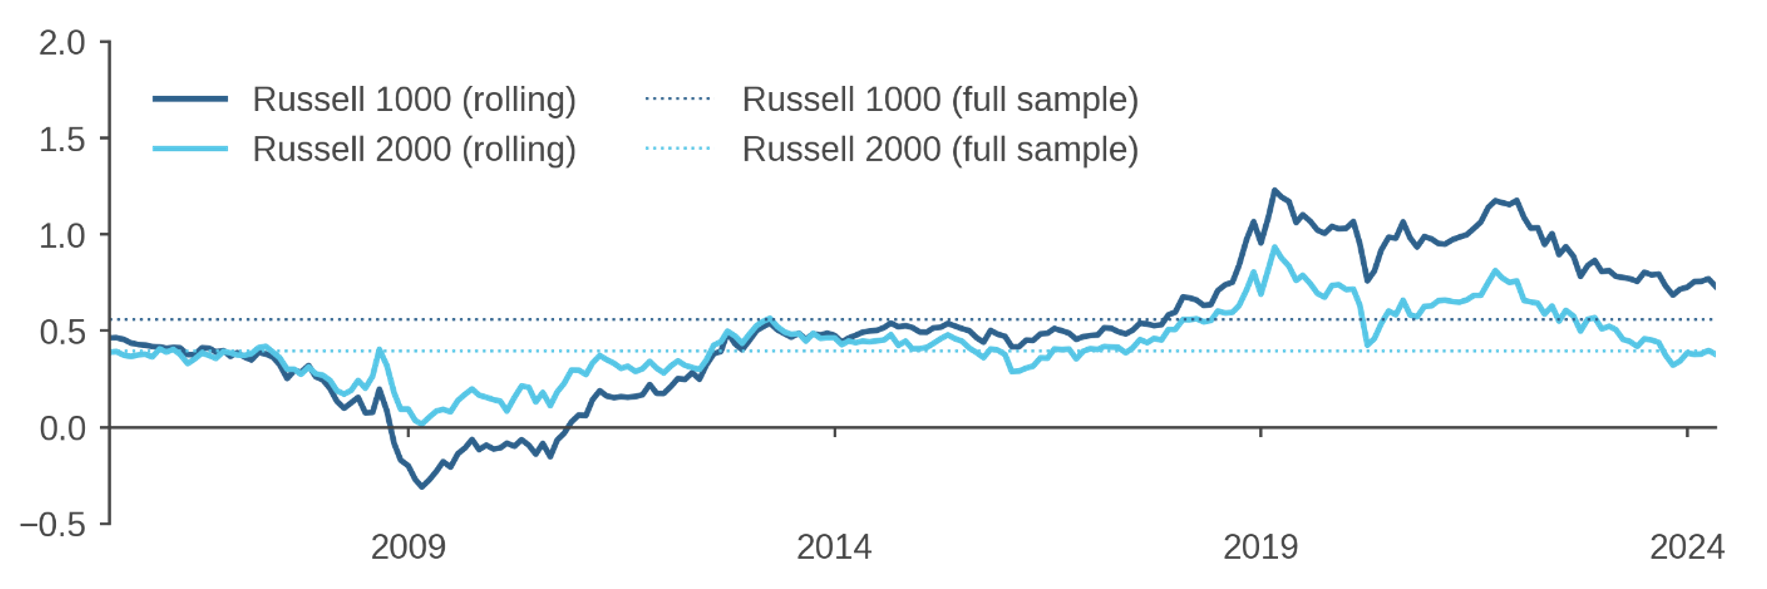
So standalone performance of U.S. small-cap stocks hasn’t been unusual. Why, then, have we seen a flurry of articles decrying them? After all, if investors’ allocations to small caps years ago were based on long-run expectations of risk and return that have been largely borne out, that would hardly seem a disappointing outcome.
The answer, of course, is that recent small-cap performance stings because it pales in comparison to the exceptionally strong performance of large-cap stocks. Over the past decade, the Russell 1000 Index realized a Sharpe Ratio that was 30% higher than since 1995, and the top tercile of stocks by market cap generated a Sharpe Ratio that was 80% above the mark realized over nearly a century, 0.80 versus 0.45.
These observations raise several questions: Could an allocator have reasonably foreseen the degree of large-cap outperformance that we have observed? Do its causes suggest that small caps are likely to face headwinds relative to large caps going forward? Would allocators be wise to remain invested in or even increase their allocation to small caps?
Small versus Large: Was Underperformance Foreseeable?
The first question is, perhaps, easy to address. It seems unrealistic, in our view, that investors could have predicted the outright and relative performance of large-cap stocks. That’s in part because large caps received a historically unusual boost from just a handful of high-flying companies, the famous “Magnificent Seven.”2
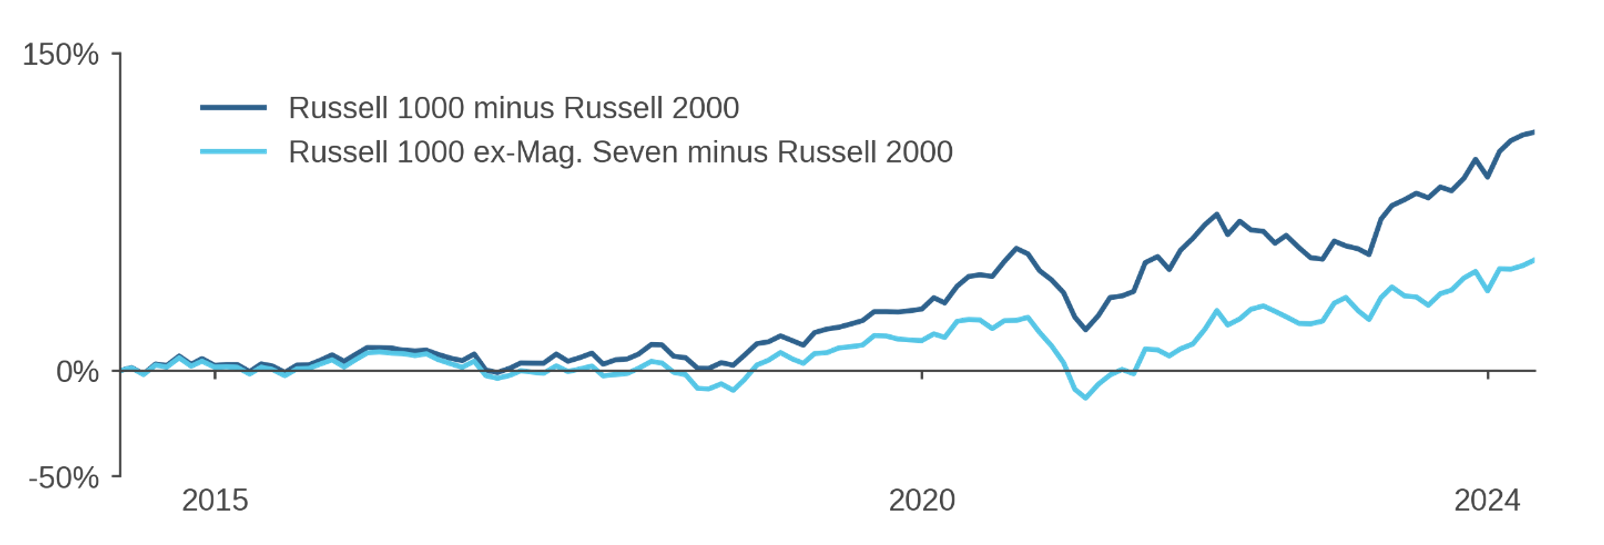
Figure 2 quantifies the impact of the Magnificent Seven on relative performance. Over the decade through April 2024, large caps delivered a cumulative return that was an astounding 113% higher than that of small caps, which translates into outperformance of 3.6% per annum (Figure 2). More than half of that came from the Magnificent Seven. Excluding those stocks, the remainder of the Russell 1000 still would have outperformed the Russell 2000, but by a much more modest 52% cumulative (1.4% p.a.).3 This implies that predicting the historic underperformance of small caps would have been tantamount to making a long-term call on the dramatic run-up in a small set of already large-cap names. Easier said in retrospect than done in advance.
Figure 2: The Impact of the Magnificent Seven on U.S. Large-Cap Outperformance
Cumulative excess returns: Russell 1000 and Russell 1000 ex-Magnificent Seven versus Russell 2000
Small versus Large: The Outlook
The second question is more difficult to answer: are small-cap stocks now meaningfully less attractive than they have been historically? Given the challenge of conclusively proving a negative, we’ll limit our discussion here to two of the most prevalent narratives around their recent underperformance.
Interest Rates
One persistent conventional wisdom blames the underperformance on small caps’ purportedly greater sensitivity to interest rates. If that conjecture were true, then perhaps small-cap stocks would continue to face headwinds should we remain in a higher-rate regime. The intuition is alluringly straightforward. Larger companies have greater flexibility to finance at fixed rates over relatively long terms by issuing bonds. Smaller firms may be forced to rely predominantly on banks or private credit sources, and they may be more exposed to floating rates. Higher yields and a higher-for-longer interest rate regime might, therefore, hit smaller firms harder.
Past changes in interest rates do not line up terribly well with the specific timing of observed small-cap underperformance, however, which calls this explanation into question. Figure 2, for example, shows that from 2014 through mid-2019, the Russell 1000 realized a cumulative return that was 24% higher than the Russell 2000. At first blush this might seem attributable to rising interest rates, since the U.S. federal funds target rate increased from 0.25% to 2.5% over the period. However, the Russell 1000 outperformed by another 16% over the next eight months as the fed funds rate dropped back to 0.25%. The index also added another 24% to its cumulative outperformance through February 2020 while the fed funds rate remained stable.4
We also analyze large-versus-small cap bond market sensitivity using the heavier machinery of a commercial risk model. This allows us to control for other factors and provides additional evidence that interest rates only had a limited impact on small-cap underperformance. Differences in interest rate exposure between the Russell 1000 and Russell 2000 explain less than 5% of the performance gap between the two indexes over the past decade. This is an order of magnitude smaller than the impact of the Magnificent Seven discussed above.5 The same analysis suggests that interest rate exposure accounts for only about 6% of variation in the difference between returns of the two indexes over the long run.
We conclude that while higher interest rates might seem a convenient explanation for small-cap underperformance, it is not likely a primary cause. It follows, therefore, that the implications of interest rates for the small-cap outlook may be more limited and less straightforward than many investors assume.
Quality
A second proposed explanation for small-cap underperformance is that these stocks have deteriorated in quality. If true, then small-cap investors would now be buying junkier stocks than a decade (or more) ago, warranting a larger valuation haircut. If the market hasn’t fully applied that haircut, then that might suggest risk of further underperformance going forward.
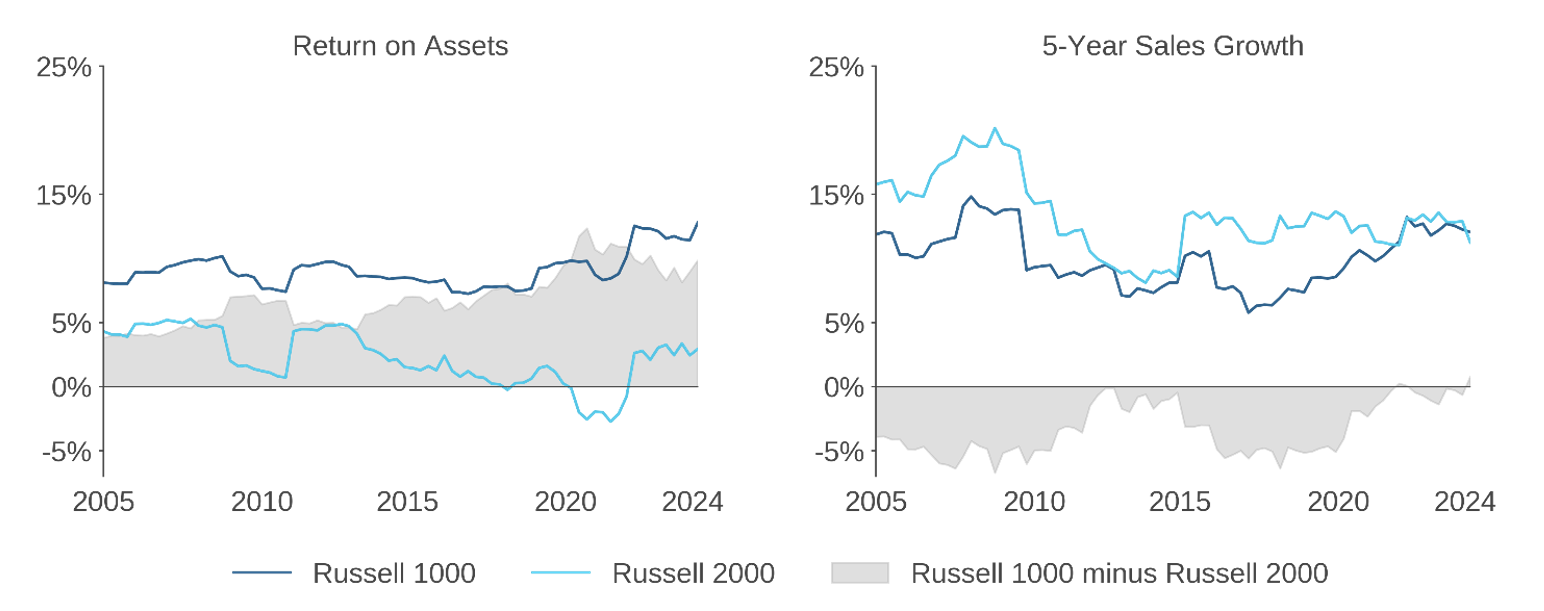
A few reasonable explanations have been proposed to support this theory. For example, some have posited that private equity firms have scooped up the higher-quality public small-cap companies, leaving predominately weaker businesses behind. Figure 3, however, provides (high-level) evidence that challenges this explanation. If high-quality smaller firms are disappearing, then we might expect to see a marked deterioration in small-cap fundamentals. But the light-blue trace in the left panel, which corresponds to one such indicator, the return on assets (ROA) of the Russell 2000, does not show compelling evidence of a downward trend.6
Another possible explanation is that mega-cap companies enjoy greater competitive moats than in the past, owing to better ability to tap increasingly important global markets in industries like software, entertainment, and services. Indeed, the rising ROA and sales growth for the Russell 1000 relative to the Russell 2000 shown in Figure 3 would seem consistent with this hypothesis (even if the reasonably stable fundamentals of small caps suggest that these companies are not having greater struggles in operating at “sub scale”).
Figure 3: Sales Growth and ROA—Large Cap versus Small Cap
The relative improvement in large-cap fundamentals could certainly help to explain their outperformance in recent years. Less clear, however, are the implications for the outlook going forward. At least to first order, the market seems to be pricing in the differential in expected growth rates across large- and small-caps. Figure 4 provides high-level evidence, showing forward-PEG ratios, i.e., forward P/E ratios relative to earnings growth estimates, for large and small U.S. stocks. It indicates that neither large-cap nor small-cap valuations look unusual relative to current earnings growth expectations in each segment.
Figure 4: Forward PEG Ratios

Perhaps a more challenging question is whether the growth expectations of large-cap stocks, and the Magnificent Seven in particular, are warranted. As noted in prior Acadian research, investors have a tendency to overextrapolate trends in fundamentals and to find convenient rationalizations for doing so.7 Trees do not grow to the sky, and there are plenty of once-mighty firms that have not quite managed to take over the world. Of the top-10 stocks in the Russell 1000 on April 30, 2004, only two remain in the top 10 on April 30, 2024: Microsoft and ExxonMobil. As another example, in the early 1970s, the market’s darlings were the Nifty-50 stocks. Some of them are still blue-chip companies today, including American Express, Coca-Cola, and IBM, but many others provide timely reminders of how the mighty may fall, including Eastman Kodak, Kmart, S.S. Kresge, Sears, and Xerox. While it is possible that “this time might really be different,” we would encourage investors not to presume that it is, and to construct portfolios based on a wide range of potential outcomes.
Active U.S. Small-Caps: Still a Robust Case
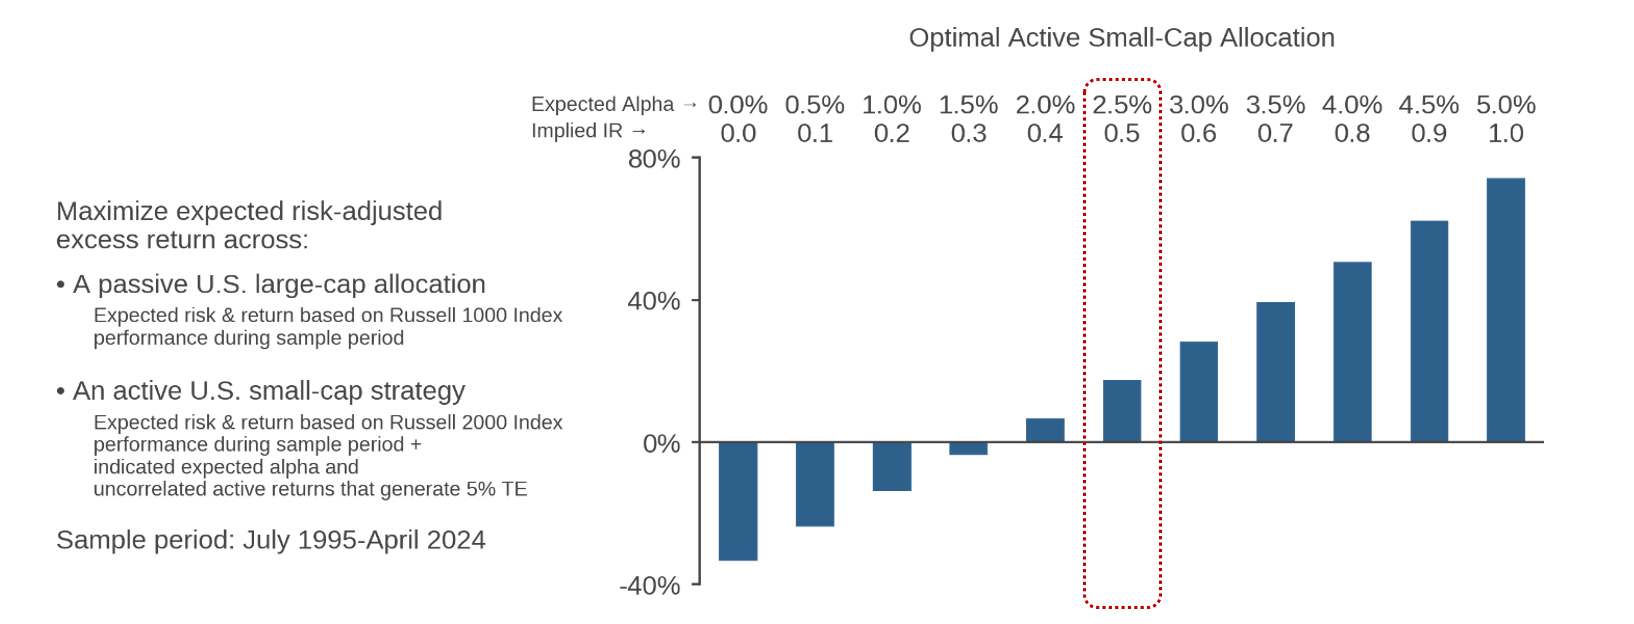
Should investors continue allocating to small caps and, if so, how much? To provide structure in answering this question, Figure 5 presents a simple exercise in which an investor allocates across two hypothetical assets to maximize a portfolio’s expected risk-adjusted return: 1) a passive U.S. large-cap allocation and 2) an active U.S. small-cap strategy.
Figure 5: Hypothetical Allocation to Active U.S. Small Caps as a Function of ex ante Alpha
This passive-large-cap, active-small-cap framing is consistent with evidence that while the large-cap segment of the U.S. equity market has become a challenging environment for stock pickers, the opportunity set is still attractive among smaller, less-efficiently priced stocks. Based on manager data reported to eVestment, for example, the median U.S. small-cap strategy generated a 2.8% annualized gross-of-fee active return over the past five years. Among large-cap U.S. strategies, in contrast, the median gross-of-fee active return was a negligible -0.02%.
We calibrate the passive large-cap allocation’s expected return and risk based on the observed excess returns (versus T-bills) of the Russell 1000 Index since July 1995. Similarly, for the small-cap active strategy, we use performance expectations based on observed Russell 2000 returns during the same period, but we make two adjustments to reflect active management. We add in an assumed level of alpha to reflect manager skill, and we modify expected risk assuming that the manager generates 5% of tracking error in the form of active returns that are uncorrelated with the index.8
Based on these assumptions, Figure 5 shows optimal allocations to the hypothetical small-cap active strategy as we vary the expected alpha. The left-most column represents the case in which the active manager has no skill, which resembles a passive small-cap allocation.9 At this baseline, not only would the investor avoid holding small caps, but the optimal allocation calls for shorting them to lever up large-cap exposure (-30% and +130% weights, respectively).
The reason for avoiding small-cap strategies in this exercise is straightforward: over the historical period that we have used to calibrate the analysis, small-cap stocks generated both meaningfully lower average returns than large-cap stocks, 8.3% and 9.1% for the Russell 2000 and Russell 1000, respectively, and the two indexes were highly correlated (0.86). As a result, small caps look like a natural hedge for large caps, and a long-large and short-small spread position generates the highest possible Sharpe Ratio. But this exercise significantly penalizes small-cap stocks relative to our long-run expectation. The sample period since 1995 is materially influenced by the past decade of historic large-cap strength, and we do not expect small caps to chronically underperform.
Yet even given these conservative assumptions, if we allow for stock-selection skill in the small-cap strategy, then the optimal small-cap allocation changes considerably. It becomes positive at a modest expected alpha of 1.68% per annum, which implies an Information Ratio (IR) of 0.34 based on the assumed 5% active risk. A target alpha of 2.5%, implying an IR of 0.5, which we view as reflecting material but realistic skill for a sophisticated manager, would warrant an optimal small-cap allocation of roughly 17%.10
This hypothetical small-cap allocation exceeds the Russell 2000’s 7% weight in the Russell 3000, a proxy for the U.S. market portfolio. In other words, given this level of manager skill, the exercise recommends a material tilt towards small caps (even in spite of the implicit assumption that small caps will face material headwinds going forward). This overweight is consistent with positioning that naturally emerges in many all-cap active strategies, because the richest alpha generation opportunity set, and therefore the most positive return forecasts, is found among smaller, less-efficiently priced names. As a result, when portfolio construction is given flexibility to allocate freely across the capitalization spectrum, it generally achieves the best return-risk trade-off by leaning into small caps.
This observation implies that investors who set separate large- and active small-cap allocations ex ante, instead of allowing them to emerge from portfolio construction within an active all-cap allocation, should consider imposing a small-cap tilt if they go active in that market segment.
Conclusion
Years ago, it would hardly have been an easy call to predict the historic rally and dramatic outperformance of U.S. large caps. Today, the outlook for small-versus-large is no easier to forecast. The task is not just about forecasting relative fundamentals over multi-year horizons, which is challenging enough, but also about assessing whether the market is mispricing the distribution of outcomes. Given the difficulty, we would recommend that investors stay invested across the cap spectrum. A key question is how. Especially in the small-cap arena, where we expect a relatively rich opportunity set for stock selection, we would encourage investors to stay active and to overweight the segment, accordingly.
Endnotes
- The long-term history is based on data from the Ken French data library, beginning in July 1926. (Copyright 2024 Kenneth R. French. All rights reserved.)
- Alphabet, Amazon, Apple, Meta, Microsoft, Nvidia, and Tesla. References to these and other stocks should not be construed as recommendations to buy or sell specific securities.
- For historical context on the contributions of the Magnificent Seven’s contribution to cap-weighted index returns, see Low-Volatility Investing: Welcoming the Elephant into the Room, Acadian, February 2024.
- Moreover, during this period large-cap outperformance was driven entirely by the Magnificent Seven. Excluding those stocks, the Russell 1000 delivered the same cumulative return through mid-2021 as the Russell 2000. Russell Investments Copyright Russell Investments 1998 - 2024. All rights reserved.
- Results are robust to variations of the analysis, including different controls and treatments of interest rate-sensitive sectors. Please contact us for further information.
- The chart shows that small-cap ROA deteriorated for a few years and bottomed in 2020-21. This may explain some of the poor performance of small caps during the COVID period and even earlier, when ROA trended lower. However, ROA has since rebounded back to historical average levels, while the relative market valuation of small-cap stocks has not. The Russell 2000 underperformed the Russell 1000 by 30% over the last three years, when ROA trends were quite positive for small caps.
- See, for example, Low-Volatility Investing: Welcoming the Elephant into the Room, previously cited, as well as The Outlook for Value, Acadian, 2019 and Acadian’s Approach to Value, Acadian, 2019.
- Therefore, the assumed variance of the active strategy is slightly higher than that of the Russell 2000, and the assumed correlation between the large-cap and small-cap strategies is slightly less than that between the Russell 1000 and Russell 2000.
- The only difference being that, in this case, the active small-cap allocation has 5% TE instead of 0%.
- If we allow for a modest expected net-of-fee alpha of 1% in a large-cap strategy, we still find economically large allocations to small caps.
Hypothetical Legal Disclaimer
Acadian is providing hypothetical performance information for your review as we believe you have access to resources to independently analyze this information and have the financial expertise to understand the risks and limitations of the presentation of hypothetical performance. Please immediately advise if that is not the case.
Hypothetical performance results have many inherent limitations, some of which are described below. No representation is being made that any account will or is likely to achieve profits or losses similar to those shown. In fact, there are frequently sharp differences between hypothetical performance results and the actual performance results subsequently achieved by any particular trading program.
One of the limitations of hypothetical performance results is that they are generally prepared with the benefit of hindsight. In addition, hypothetical trading does not involve financial risk, and no hypothetical trading record can completely account for the impact of financial risk in actual trading. For example, the ability to withstand losses or to adhere to a particular trading program in spite of trading losses are material points which can also adversely affect actual trading results. There are numerous other factors related to the markets in general or to the implementation of any specific trading program which cannot be fully accounted for in the preparation of hypothetical performance results and all of which can adversely affect actual trading results.
Legal Disclaimer
These materials provided herein may contain material, non-public information within the meaning of the United States Federal Securities Laws with respect to Acadian Asset Management LLC, Acadian Asset Management Inc. and/or their respective subsidiaries and affiliated entities. The recipient of these materials agrees that it will not use any confidential information that may be contained herein to execute or recommend transactions in securities. The recipient further acknowledges that it is aware that United States Federal and State securities laws prohibit any person or entity who has material, non-public information about a publicly-traded company from purchasing or selling securities of such company, or from communicating such information to any other person or entity under circumstances in which it is reasonably foreseeable that such person or entity is likely to sell or purchase such securities.
Acadian provides this material as a general overview of the firm, our processes and our investment capabilities. It has been provided for informational purposes only. It does not constitute or form part of any offer to issue or sell, or any solicitation of any offer to subscribe or to purchase, shares, units or other interests in investments that may be referred to herein and must not be construed as investment or financial product advice. Acadian has not considered any reader's financial situation, objective or needs in providing the relevant information.
The value of investments may fall as well as rise and you may not get back your original investment. Past performance is not necessarily a guide to future performance or returns. Acadian has taken all reasonable care to ensure that the information contained in this material is accurate at the time of its distribution, no representation or warranty, express or implied, is made as to the accuracy, reliability or completeness of such information.
This material contains privileged and confidential information and is intended only for the recipient/s. Any distribution, reproduction or other use of this presentation by recipients is strictly prohibited. If you are not the intended recipient and this presentation has been sent or passed on to you in error, please contact us immediately. Confidentiality and privilege are not lost by this presentation having been sent or passed on to you in error.
Acadian’s quantitative investment process is supported by extensive proprietary computer code. Acadian’s researchers, software developers, and IT teams follow a structured design, development, testing, change control, and review processes during the development of its systems and the implementation within our investment process. These controls and their effectiveness are subject to regular internal reviews, at least annual independent review by our SOC1 auditor. However, despite these extensive controls it is possible that errors may occur in coding and within the investment process, as is the case with any complex software or data-driven model, and no guarantee or warranty can be provided that any quantitative investment model is completely free of errors. Any such errors could have a negative impact on investment results. We have in place control systems and processes which are intended to identify in a timely manner any such errors which would have a material impact on the investment process.
Acadian Asset Management LLC has wholly owned affiliates located in London, Singapore, and Sydney. Pursuant to the terms of service level agreements with each affiliate, employees of Acadian Asset Management LLC may provide certain services on behalf of each affiliate and employees of each affiliate may provide certain administrative services, including marketing and client service, on behalf of Acadian Asset Management LLC.
Acadian Asset Management LLC is registered as an investment adviser with the U.S. Securities and Exchange Commission. Registration of an investment adviser does not imply any level of skill or training.
Acadian Asset Management (Singapore) Pte Ltd, (Registration Number: 199902125D) is licensed by the Monetary Authority of Singapore. It is also registered as an investment adviser with the U.S. Securities and Exchange Commission.
Acadian Asset Management (Australia) Limited (ABN 41 114 200 127) is the holder of Australian financial services license number 291872 ("AFSL"). It is also registered as an investment adviser with the U.S. Securities and Exchange Commission. Under the terms of its AFSL, Acadian Asset Management (Australia) Limited is limited to providing the financial services under its license to wholesale clients only. This marketing material is not to be provided to retail clients.
Acadian Asset Management (UK) Limited is authorized and regulated by the Financial Conduct Authority ('the FCA') and is a limited liability company incorporated in England and Wales with company number 05644066. Acadian Asset Management (UK) Limited will only make this material available to Professional Clients and Eligible Counterparties as defined by the FCA under the Markets in Financial Instruments Directive, or to Qualified Investors in Switzerland as defined in the Collective Investment Schemes Act, as applicable.
Biographies

