Over the past decade, private credit offerings delivered on higher return expectations as investors reached for yield in a low-interest-rate environment. However, the appeal of this asset class, both in absolute terms and relative to public corporate credit, has diminished in today’s environment. The obligations that underly most private credit investments tend to be floating rate debt, issued by companies that are often riskier (smaller and more highly levered) than firms that issue bonds in public markets. Today’s higher yields and an uncertain economic environment are calling into question whether these borrowers can service the higher debt costs with potentially slowing profits.
In this note we appraise the current outlook for private credit, focusing on aspects of the asset class that are misunderstood or underappreciated by many market participants. After correcting for distortions in reported returns and risk, we provide evidence that private credit investments do not earn superior risk-adjusted performance compared to other asset classes. Moreover, we call into question the conventional wisdom that private credit’s outperformance is due solely to an illiquidity premium.
As a result, although private credit, with assets over a trillion dollars, warrants an allocation from many asset owners due to its economic significance, we would caution investors not to charge blindly forward. Independent and critical due diligence on private investments is essential.
Private Credit Performance – Only as Meaningful as the Inputs
At first glance, returns to private credit, as proxied for by direct lending, would seem a panacea for allocators. When compared to traditional asset classes, such as stocks and bonds, direct lending has realized both the highest return and the lowest volatility, which together translate into apparently far superior risk-adjusted returns. (Figure 1) In fact, based on reported performance, a simple mean variance optimization would allocate close to 100% to private credit.
That is a suspicious result, however. Instead of demonstrating the superiority of private credit investments, it suggests that the reported returns and volatility of private credit should be modified in two ways to allow for meaningful comparisons with other asset classes.
First, common direct lending indexes should be adjusted for management fees. While evaluating all asset classes gross of fees might appear like an apples-to-apples comparison, the fees in private credit are much higher, often in the 3-4% range versus 0.5% for public market assets. Hence, a gross-of-fee comparison does not represent what investors take home on an equal footing.1
Second, while volatility can be a valuable metric of risk, when private market reported returns are used in its calculation, it is almost meaningless. That’s because private credit assets are illiquid, almost never trading. They are marked to market at most quarterly, and the quality of those marks is questionable in the absence of traded prices of similar assets. This infrequent mark-to-model (discretionary) pricing significantly dampens volatility relative to the economic reality, which inflates Sharpe Ratios.
Figure 1 provides a performance comparison that adjusts for these biases. We conservatively reduce direct lending index returns by average management fees (in excess of assumed fees for other asset classes, 0.5%) and increase volatility so that it is in-line with bank loans, which are also floating rate loans that bear similar credit risk but are actively traded and thus marked to market.2 After making these adjustments, we see the risk-adjusted return for direct lending move from the “unicorn zone” to be in line with other asset classes.
Figure 1: Risk-Adjusted Performance: A Cross-Asset Comparison
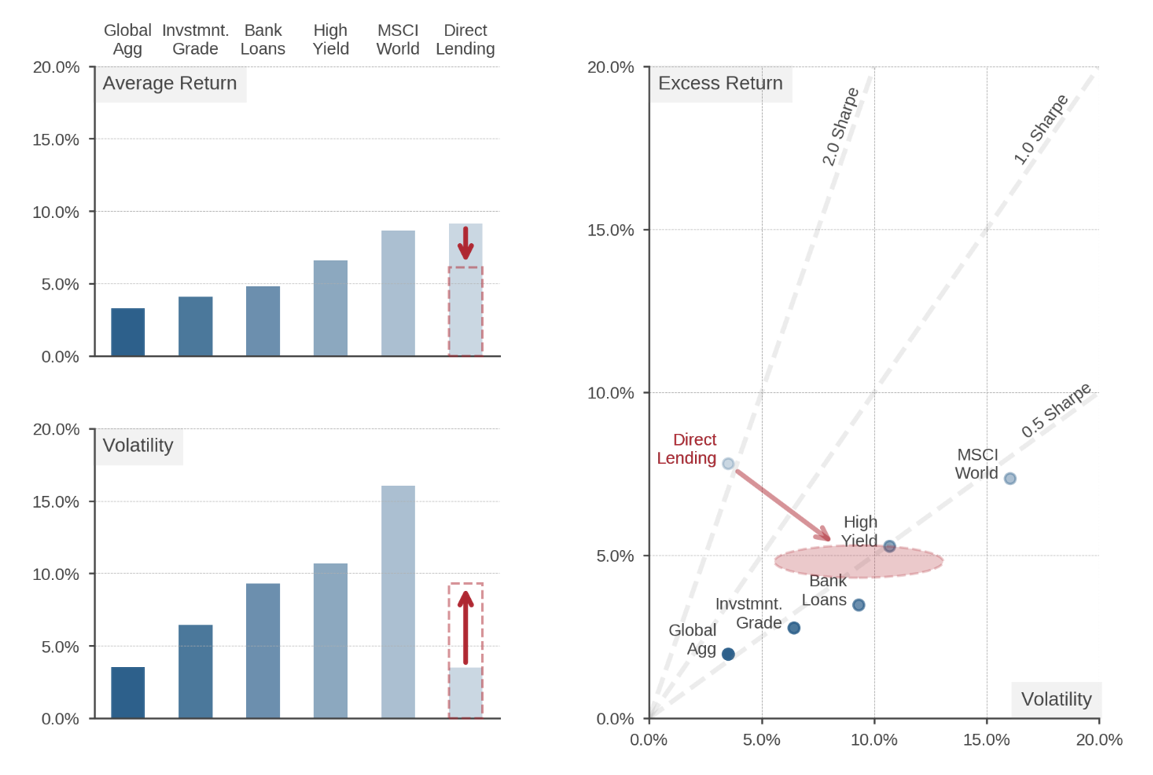
Source: Bloomberg, MSCI, ICE. Data is from September 2004 to June 2023. MSCI Copyright MSCI 2023. All Rights Reserved. Unpublished. PROPRIETARY TO MSCI. This is meant to be an educational illustrative exhibit and is not intended to represent investment returns generated by actual portfolios. Hypothetical results do not represent actual trading or an actual account or reflect transaction costs or advisory fees. Hypothetical results are not indicative of actual future results. Every investment program has an opportunity for loss as well as profit.
The Illusory Liquidity Premium
Many investors who allocate to private credit do so in the hope of realizing a liquidity premium. Yet while it is true that private credit markets have offered additional yield above their public counterparts, several pieces of evidence point to higher credit risk, not a liquidity premium, as the major driver of these higher yields. S&P Global Ratings provides credit estimates on $400 billion of unrated private debt held in middle-market CLOs. Per their analysis, 78% of these issuers would be rated B- and 13% CCC – this is meaningfully lower credit quality than the public high yield space which has roughly 50% BB rated bonds plus an additional 30% B+ and B rated on a market value basis.3 Furthermore, as interest in private credit has increased the spread between private and public markets has collapsed in recent years, as shown in the stacked bar chart in Figure 2. The yield differential between direct lending and bank loans (shown in light blue) is 2.5% today after averaging 5.2% since 2004. This suggests that any preexisting liquidity premium has shrunk markedly. Even more directly, however, we are unaware of any reliable analysis that links higher yields or returns on private credit solely to liquidity. Moreover, in an analysis of the public high yield market, where data is readily available, we find no evidence of a premium on less liquid bonds after controlling for credit risk.4 In summary, we would caution investors against blindly accepting assertions of a private credit liquidity premium.
Figure 2: Direct Lending Excess Yield Versus Bank Loans
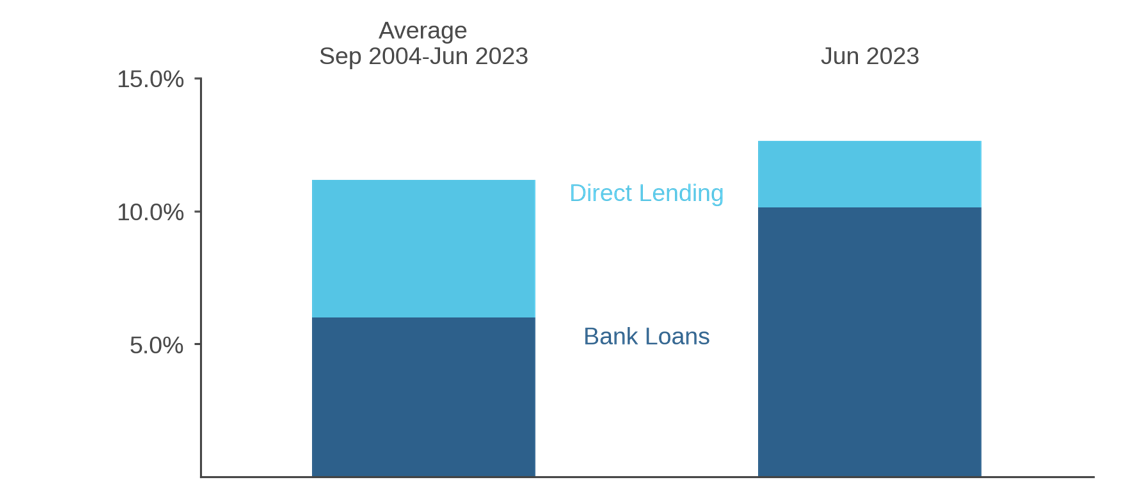
Period ending June 30, 2023. Source: Cliffwater. Yield to maturity is used for Bank Loans, Morningstar Leveraged Loan 100 Index. 3-Year Takeout is used for Direct Lending, CDLI. For illustrative purposes only.
A Hedge against Rising Interest Rates – Until it Isn’t
Interest payments on floating rate debt typically increase with a specified reference rate, most commonly the Secured Overnight Funding Rate (SOFR). Lenders receive higher coupon payments as interest rates increase, leading many investors to assume that floating rate offerings, such as direct lending, provide a hedge against rising rates. This assumption is only true, however, if borrowers can continue servicing their higher debt costs.
It is difficult to determine how a young asset class such as direct lending will weather a higher-for-longer interest rate environment. The Cliffwater Direct Lending Index incepted only eight years ago, and even with backfilled data since 2004, it does not cover regimes of meaningful monetary tightening. As a result, we view performance from this period as offering little value in predicting how direct lending will fare in the current environment where the dramatic rise in rates has meaningfully increased interest expenses on direct lending and bank loans. Since the Fed began its hiking cycle in March 2022, the average coupon payment for private debt issuers increased from roughly 7% to over 12%. In contrast, issuers with bond-only capital structures saw their coupon payment rise by roughly 50bps.5
Instead, we believe that private credit investors should be wary of companies’ debt servicing ability in direct lending markets given the lower quality and highly levered nature of many borrowers. Moreover, the inflationary pressures that have been a major driver of rising rates warrant further caution, since they tend to compress operating margins.
Conclusion
Credit has an evergreen appeal and deserves inclusion in investor portfolios.6 Private credit markets warrant a portion of this allocation, given that they are of similar size to the high yield corporate bond market. (Figure 3) We are concerned, however, that some asset owners are overweighting private credit investments on the basis of reported performance that masks fees and volatility, a widespread misconception that private credit delivers a meaningful illiquidity premium, and neglect of pressures on companies’ ability to service rising interest burdens. As such, we would encourage asset owners to review the balance of their private and public credit allocations, and to conduct independent and critical due diligence on direct lending investments.
Sidebar: Overview of the U.S. Corporate Debt Market
Companies have two main avenues for debt financing: they can issue a bond or take out a loan. Bonds typically have a fixed-rate coupon, while loans tend to be floating rate. Borrowing can be done privately, through one or more lenders (direct or broadly syndicated), or in public markets, which offer secondary trading.
Figure 3 provides a high-level overview of the $13.5 trillion U.S. Corporate debt market. Public bonds make up the majority, 55% from investment grade companies and another 9% from high yield. The loan market, in total, accounts for $4.9 trillion and is broken up into broadly syndicated loans, bank commercial and industrial loans, and private debt. Within the private debt market, direct lending represents a sizeable portion alongside distressed lending and venture funding, among other sources. Depending on their financing needs, health, and underlying corporate structure, companies may tap into multiple segments of the corporate debt market or be limited to a particular slice.
Figure 3: The U.S. Corporate Debt Market
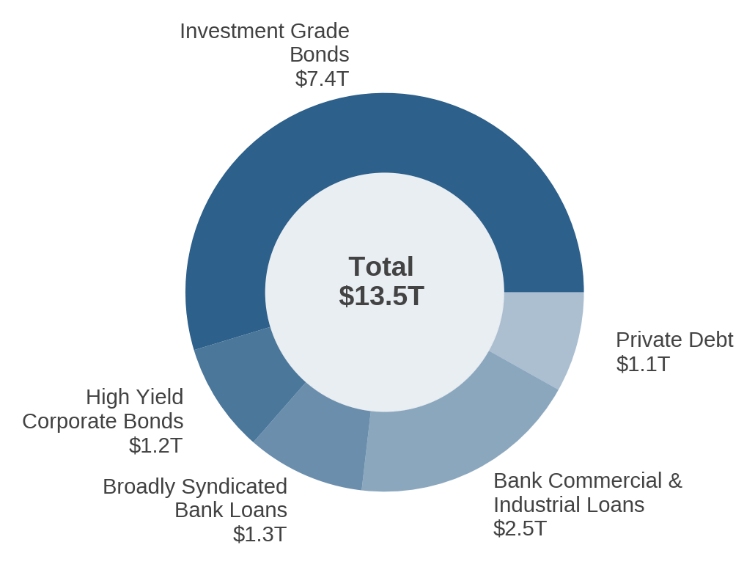
As of December 31, 2022. Source: ICE, Morningstar, Goldman Sachs, S&P Global Market Intelligence.
Private debt markets have grown substantially since 2010, from $200 billion to $1.1 trillion. Due to regulatory changes after the GFC, many banks reduced the amount of loans made to smaller and lower quality corporations. While private lending firms had been active prior to the GFC, they identified this financing gap as an opportunity for investor capital.
Unlike bonds and broadly syndicated bank loans which have an active secondary market, direct loans are privately originated and are not publicly traded. Prices are set quarterly using managers’ valuation models and audited by external parties yearly. Companies borrowing in this sector typically are not rated by major agencies. To gain access, investors deploy capital via private funds or closed-end business development companies, which may be publicly traded. In the former, investor capital will be locked up for an extended period (e.g., 5-10 years). Leverage is typically employed to enhance fund returns.
|