Systematic credit is a growing approach to corporate bond investing that seeks to harvest alpha from overlooked parts of the market. While the active returns are additive to those of incumbent discretionary managers, the benefits of a systematic approach extend beyond their return profile. Systematic approaches can more easily offer greater transparency to the end investor as well as capitalize on the asset class’s fragmented trading market. These additional benefits are already achievable but are based on a manager’s choice and skillset.
What is systematic credit?
Acadian’s credit researchers develop fundamental investment ideas to capitalize on mispricings across the corporate bond market. These mispricings tend to be repeatable, smaller edges that are more data intensive than human traders are capable of processing. A systematic process, aided by modern computing, allows for testing, combining, and implementing investment ideas into a series of models. Investment models, or signals, are used together with risk and trading models to build a portfolio that can be implemented in a risk-aware manner with a focus on minimizing transaction costs. The resulting strategy is fully active with return (and tracking error) targets in line with the broader active space. Additionally, active returns have been shown to be diversifying to traditional approaches (please see Current Opportunities in Public Credit Markets).
To get a sense of what a signal within a systematic investment model looks like in practice consider the following example. A portfolio manager begins with the thesis that bonds with higher carry will outperform. First, this statement needs to be explicitly defined to properly assess. How is carry being measured? Option-adjusted spread (OAS)? Is there consideration for rolldown? Do you estimate an issuer specific credit curve? If yes, which bonds should be used for estimation? Are all bonds equally informative (e.g., less liquid bonds should not have undue influence)? Should you use bonds from related issuers? Is there an OAS level that is too high and should be excluded? Once the exact “rules” of the idea are systemized, it can be statistically tested. If the idea is valid, we should see broad evidence across rating categories, regions, and time periods.
Figure 1: Summary of Acadian’s Systematic Credit Investment Process
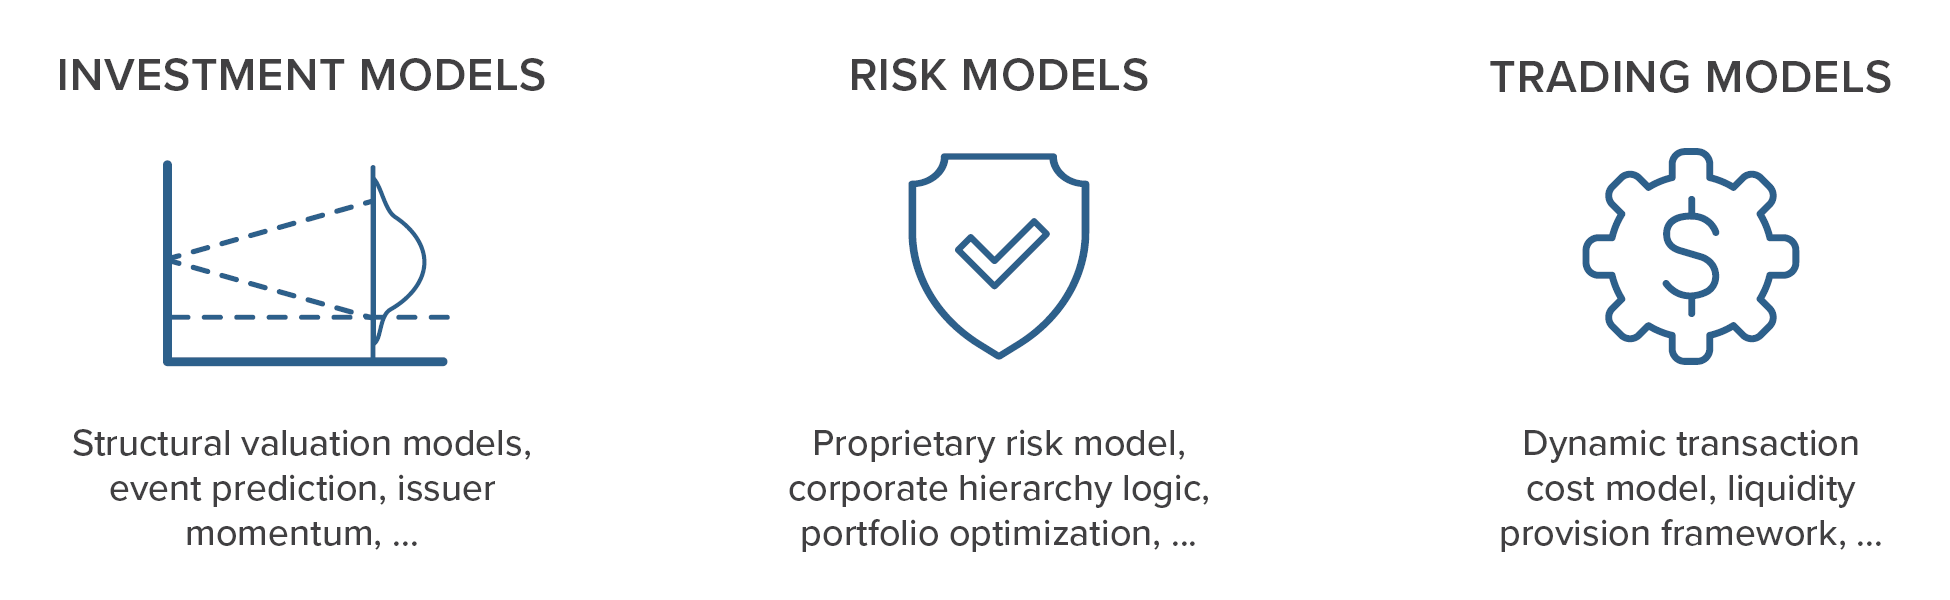
Source: Acadian.
This approach to investing has numerous benefits. Investment ideas can be tested historically to understand the general return profile as well as expected performance during different market environments. Systematic approaches help remove behavioral biases from the investment process, and possibly capitalize on the behavioral mistakes of other market participants. Additionally, while the above signal example is straightforward and could be analyzed in a simple spreadsheet, having a robust infrastructure allows for easily testing complex investment ideas and those which require very large data sets.
Advantages beyond returns: Transparency & Implementation Efficiency
Systematic credit offers additional benefits beyond delivering a robust and diversifying active return stream. One is transparency. Systematic approaches codify their decision-making process in advance. Doing so is enormously valuable in understanding portfolio composition at any point in time and in attributing performance ex post. How much of this transparency a systematic manager chooses to share with investors is a business decision, which depends on the complexity of their process, costs of clearly communicating information (in terms of both people and tools), and risk of intellectual property leakage. That said, because such transparency is virtually non-existent in the broader credit space, both public and especially private credit, we believe that it is especially valuable to provide investors.
As an example of the insight a systematic approach can provide in understanding portfolio composition, Figure 2 is a snapshot from a real-time visualization tool to inspect a return forecast for any given bond in our investable universe. We have expressed the final forecast as a (cross-sectional) Z-score. For this given bond its total Z-score is 2.3 (shown in the center of the diagram). This forecast reflects contributions from diverse individual signals, which are captured in the outer ring. Moving towards the center, the second and third rings aggregate the individual signals to successively higher levels, first into aggregate factors and then into broad color-coded themes that map to semantics that should be familiar to credit investors, including Value, Carry, and Momentum. As an illustrative example, the signal marked “Carry | Issuer Curve | Signal 1” is an individual predictor in a family of Issuer Curve-related signals within the Carry theme. The size of each wedge within each ring represents the contribution of the individual signal, aggregate signal, or theme to the bond’s forecast.
Figure 2: Bond Return Forecast Example

Source: Acadian. The information provided is for illustrative purposes only based on proprietary models. Individual signals are shown in the outer layer, which can be classified into aggregate factors in the middle layer, and general themes in the inner layer.
Figure 3 illustrates the transparency that the systematic approach affords with respect to performance attribution. The chart breaks out active returns of a hypothetical investment grade portfolio into allocation effects, in this case associated with positioning by sector and rating, and individual bond selection within those categories.1 More generally, over any period of live performance, similar attribution tools allow us to decompose return drivers into exposure to various alpha signals as well as diverse risk factors, including sector, ratings, size, maturity, duration, and region.
Figure 3: Brinson Attribution Example
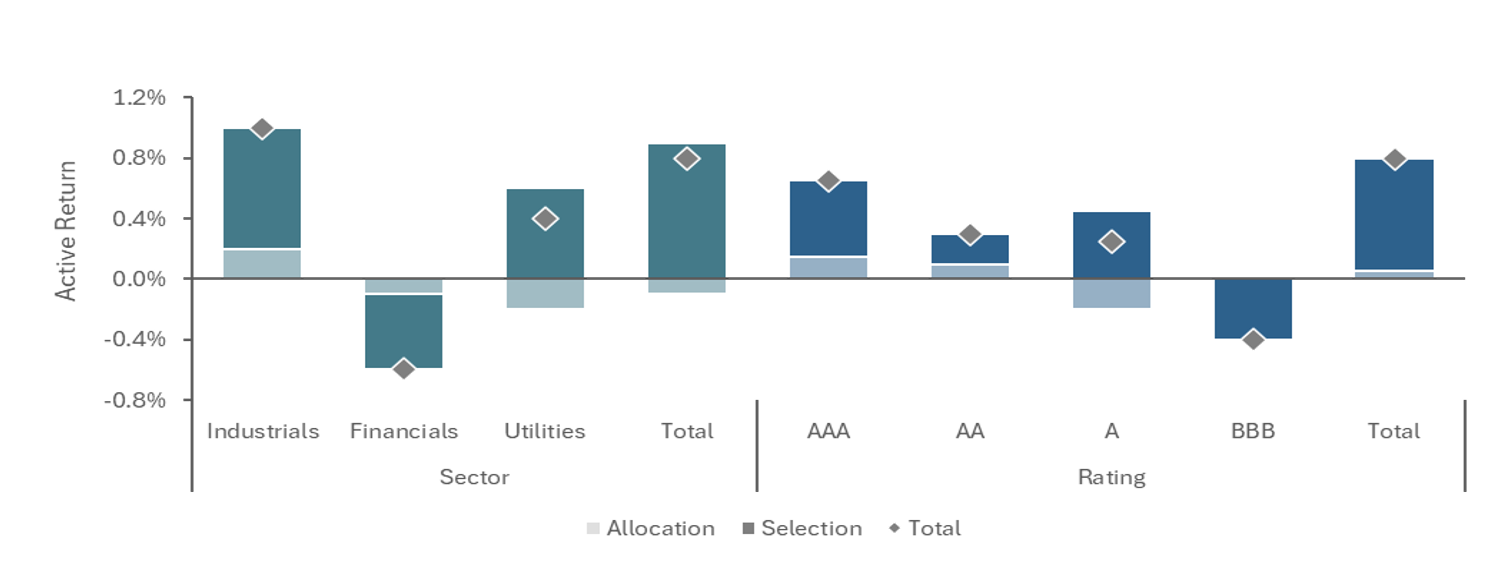
Source: Acadian. The information provided is for illustrative purposes only and is not intended to represent investment returns generated by an actual portfolio. Sample Brinson attribution is shown across sectors and ratings for a hypothetical investment grade strategy. The total active return will be the same across sector or rating, but the decomposition will differ.
In addition to allowing for unprecedented transparency, systematic approaches are well-suited to take advantage of the still fragmented corporate bond trading environment, which the advent of electronic bond trading has made easier but still not easy to navigate. We find the largest implementation benefits come from the ability to process vast amounts of trading data and react in real-time to short-term market opportunities.
Given the fragmentation of corporate bond trading, digesting many data sources simultaneously allows one to develop realistic transaction cost estimates, determine the best venue to trade a given bond, and analyze execution quality. Figure 4 showcases the benefit in developing a consolidated market view based on a variety of different sources. The left-hand axis shows the percent of bonds in the high yield universe for which each source provides quotes. The right-hand axis shows the distribution of those quotes. The consolidated market view has near complete coverage with a tighter bid/ask spread.
Figure 4: Trading Market View Consolidated from Multiple Inputs
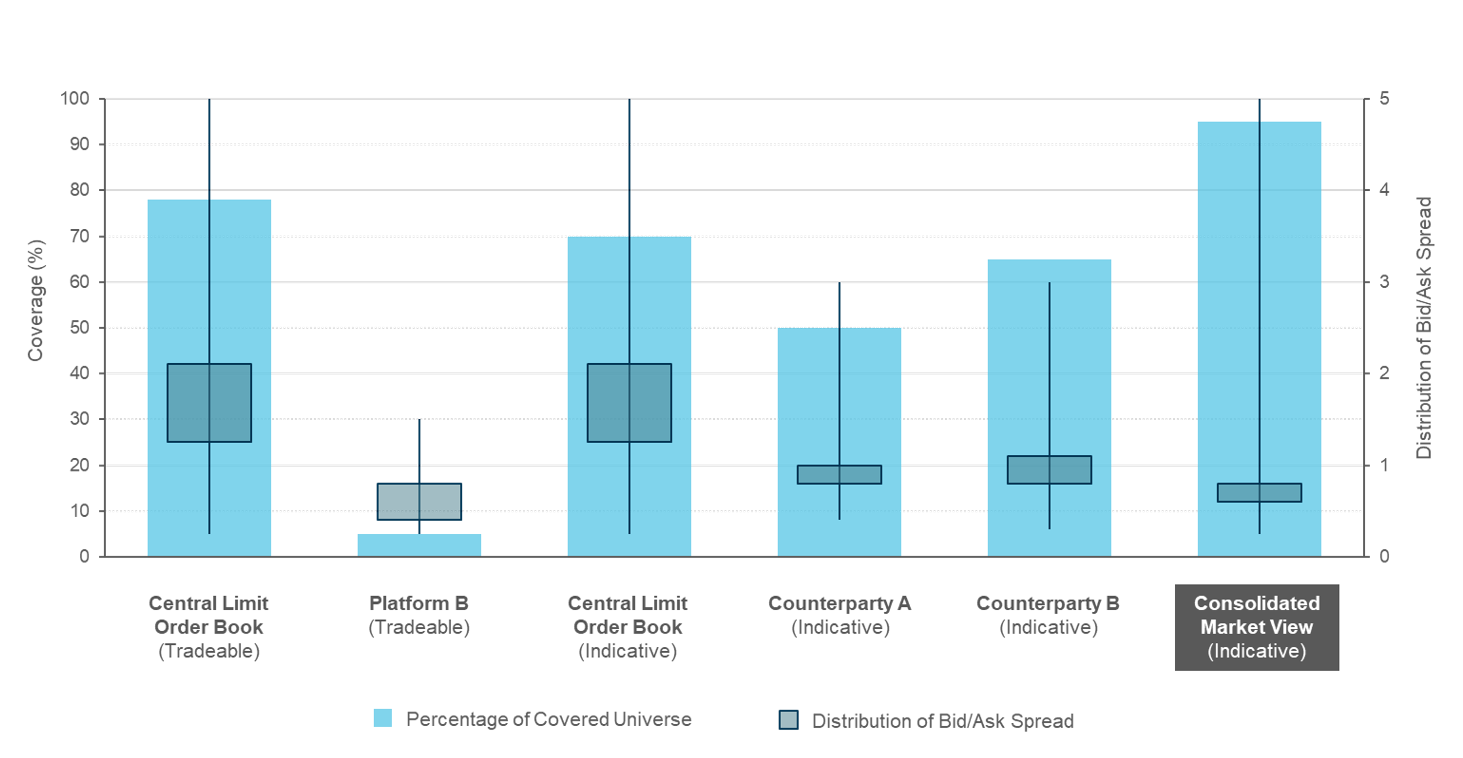
Source: Acadian. The information provided is for illustrative purposes only. Coverage is defined as the percent of bonds in the specified benchmark universe. The distribution of bid/ask spread is computed by calculating the spread for each bond and plotting the distribution for the entire covered universe.
Moreover, having real-time views on every issuer and issue, and how each bond fits into a given portfolio, allows for potentially reduced transaction costs when participating intelligently in both the primary and secondary markets.
Conclusion
Systematic credit can deliver robust active return streams that are distinct from those generated by traditional discretionary credit managers. Beyond additive performance, they can also offer two less-obvious benefits to asset owners. Although systematic methods are sometimes described as “black boxes,” they can more easily provide asset owners with transparency regarding drivers of portfolio composition and performance. Moreover, the still-fragmented bond trading environment can offer opportunities in execution.
Systematic managers have choices to make, however, in terms of how much transparency they offer to their investors and the resources that they devote to trading-related data and research. At Acadian, we view both as high priorities that are worthy of significant resourcing. Their broader embrace across the credit investing community would revolutionize the asset class.