Emerging market (EM) equity investors have many decisions to make in crafting their allocations: active or passive, diversified or concentrated, discretionary or systematic? In this note we make the case for a systematic active approach.1
We first present compelling evidence to go active. Emerging markets are inefficiently priced, which provides a reservoir of mispricings that allows active managers to thrive. Next, we argue for systematic approaches to active EM investing based on the enduring efficacy of their forecasting signals and advantages in risk control. Finally, we urge systematic active investors to embrace an expansive investment universe in EM, one that leans into the most distinctive and inefficient segments of these markets, including small caps.
Choose Active
In EM equities, active is the most natural investing posture. The primary reason is that the inefficiency of these markets offers terrific opportunity for stock selection. Figure 1 documents origins of this inefficiency. Compared to developed markets, the information environment in EM is poor, as evidenced in the left panel by analyst coverage for large caps. (See Figure 6 for small caps.) Trading conditions are also more challenging, as measured in the right panel by bid-ask spreads. Together, these characteristics foster stock-level mispricings that persist long enough for active managers with skilled implementation to exploit.
Figure 1: Roots of Inefficiency in EM—Information Environment and Trading Conditions
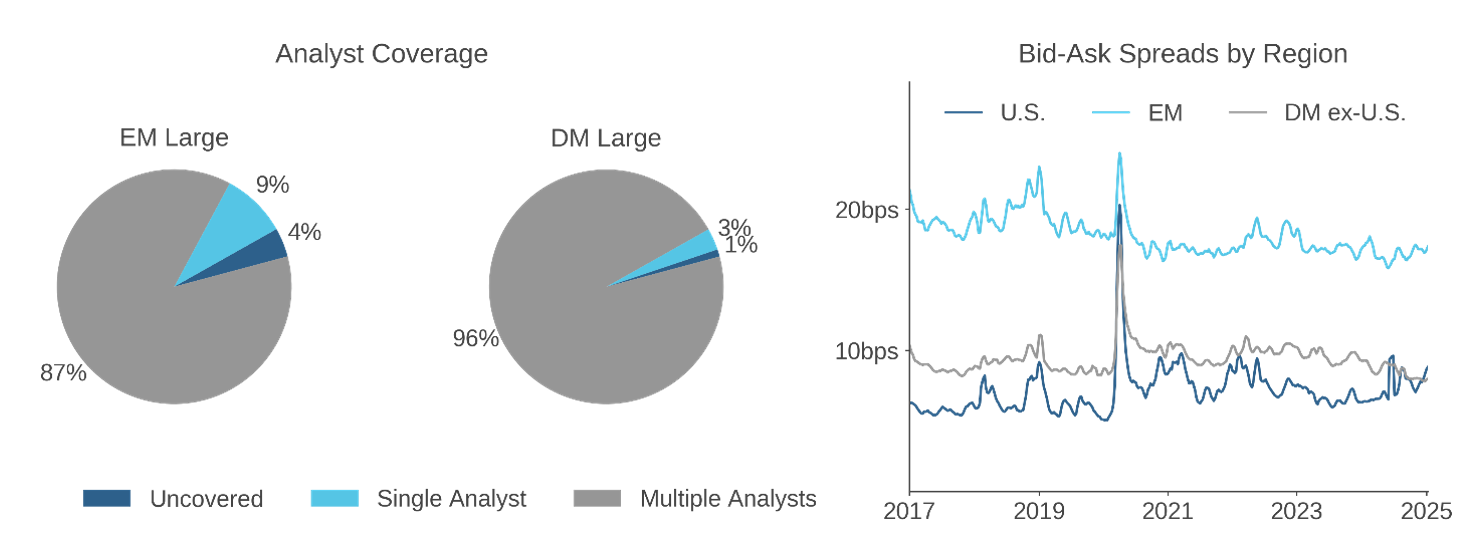
Left chart: Based on availability of IBES estimates of next-year earnings-per-share. Right chart: Float-adjusted cap-weighted rolling one-month average bid-ask spread for stocks with at least $125K ADV. Universe referenced in both charts – stocks in Acadian EM and DM investment universes with market cap over $10B. Source: Acadian. For illustrative purposes only.
The benefit for investors is evident in Figure 2, which compares active managers’ performance across regions over roughly the past decade. In EM, even a lower quartile (25th percentile) active strategy generated positive active returns, higher than in EAFE and in sharp contrast to managers’ struggles in the U.S.
Figure 2: Large-Cap Active Manager Returns by Region
Average annualized gross-of-fee active returns, Sep 2014-Sep 2024. Strategies in eVestment U.S., EAFE, EM large-cap universes.
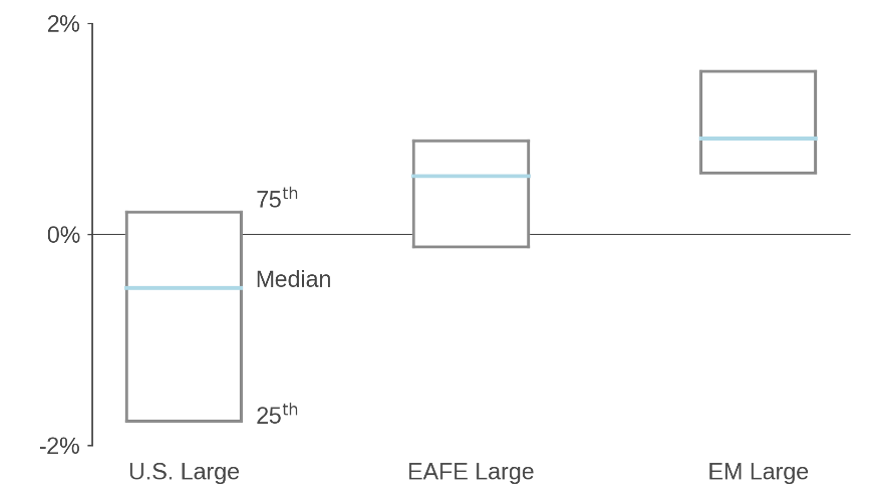
U.S., EAFE and EM active returns measured relative to the Russell 1000, MSCI EAFE, and MSCI EM Indexes, respectively. Observations limited to strategies with over $20 million AUM at each point in time and at least 5 years of available returns over the full sample period. Source: Acadian based on data from eVestment. Please see additional eVestment disclosure at the end of the paper. Past performance is no guarantee of future returns. For illustrative purposes only. MSCI Copyright MSCI 2025. All Rights Reserved. Unpublished. PROPRIETARY TO MSCI. Russell Investments Copyright© Russell Investments 1998 – 2025. All rights reserved.
Another more subtle reason to opt active in EM is that choosing passive may not provide the simplicity and transparency that asset owners anticipate. That’s in part because EM benchmark indexes are themselves active constructs. Their sponsors disagree as to which countries are emerging and which stocks to include and at what weight, and in EM these decisions have first-order consequences for index composition and characteristics.2 For this and other reasons, going passive in EM is unlikely to be a “set and forget” path.
Choose Systematic
The archetypal systematic stock selection model is designed to capture return premia that arise from investors’ incomplete information, perceptual biases, and irrational behaviors. In EM, signals based on such phenomena, including fundamental- and sentiment-based predictors, have demonstrated robust efficacy. Figure 3 provides one transparent, arms-length metric. MSCI’s EM value-, quality-, and momentum-based factor indexes have outperformed the standard benchmark, as has a multifactor blend.3 Moreover, these indexes represent only rudimentary implementations of commoditized signals applied in the mid-to-large-cap segment of EM, and more sophisticated systematic signals exhibit superior efficacy, as we have discussed in prior research.4 In addition, the potential for systematic alpha generation is also greater among small-cap EM stocks, as we show in the next section.
Figure 3: Long-Term Performance of Systematic Signals in EM
Annualized MSCI EM factor index active returns versus cap-weighted benchmark, 2000-2024.
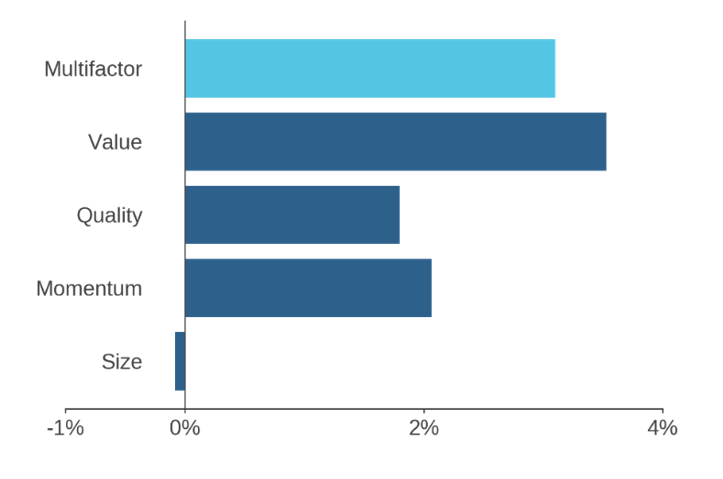
Source: Acadian based on data from MSCI, copyright MSCI 2025, All Rights Reserved. Unpublished. PROPRIETARY TO MSCI. Past performance is no guarantee of future returns. Investors have the opportunity for losses as well as profits. The above does not represent investment returns generated by actual trading or an actual portfolio. It is not possible to invest in any index. For illustrative purposes only.
There is also a compelling case for systematic investing in EM based on its advantages in risk control. An intuitive motivation comes from our prior research on geopolitical event risk.5 Local geopolitical shocks, including civil disruptions, coups, assassinations, and natural disasters, are unfortunately common in emerging countries, and EM investors would be wise to control exposure to such events through prudent geographic diversification.
Systematic portfolio construction methods are particularly well equipped to provide it. They explicitly optimize tradeoffs between expected portfolio return and risk, a process that causes them to diversify uncompensated risks, geographic and otherwise. Moreover, in doing so, the scalable methods permit the efficient exploitation of the entire investment universe. Systematic portfolio construction also offers a ready framework in which to explicitly limit portfolio exposure to myriad sources of risk, and managers have enormous flexibility in configuring these controls to suit both market context and investors’ tolerances.
In contrast, one of the most popular forms of EM investing, macro-thematic, explicitly rejects diversification and embraces concentrated risk. Over the years, a host of narrow EM investing themes have come and gone, including the BRICS, Fragile Five, Next Eleven, and the BATX.6 Figure 4 illustrates the risks of herding into such themes. Investors who mistimed the startling BATX rally would have been crushed by the Chinese regulatory crackdown on large platform companies in late 2020.7 Beyond anecdote, academic research has provided rigorous evidence of the risks of performance chasing. For example, investors make ill-timed allocation decisions by overreacting to what they see in the rear-view mirror.8 As a result, we view thematic investing in EM (and elsewhere) as more likely to fall victim to hindsight bias and other behavioral mistakes rather than to produce enduring success.
Figure 4: Risks of Thematic EM Investing—Case of the BATX

Light blue: cumulative return of an equally weighted basket of Alibaba, Baidu, Tencent, and Xiaomi (BATX). Dark blue: cumulative return on an MSCI EM Index portfolio that excludes the BATX stocks and is float-adjusted and cap-weighted. Source: Acadian based on data from MSCI. MSCI data copyright MSCI 2025, All Rights Reserved. Unpublished. PROPRIETARY TO MSCI. Past performance is no guarantee of future returns. For illustrative purposes only.
More broadly, the heuristic portfolio construction methods that typify discretionary strategies pose other drawbacks in diversification. Often risk managed to just a few broad portfolio characteristics and lacking the scalability to effectively employ a broad investment universe, we expect them to manifest unintended risk exposures, style drift, as well as suboptimal trade-offs among known return premia.9 By comparison, the advantages of systematic portfolio construction in controlling risk are clear.
Embrace an Expansive Investment Universe
In their active EM equity allocations, we would encourage asset owners to embrace an expansive investment universe. One reason is that as global financial markets became increasingly integrated over recent decades, emerging markets lost some of the distinctiveness that merited their treatment as a separate asset class. Figure 5 quantifies the change, showing that the fraction of variation in EM stock returns explainable by global risk factors increased over the past 25 years.10 To push back against that trend, active EM investors would be wise to emphasize segments of EM that retain greater “local” flavor rather than, say, focusing on the largest, globalized firms that dominate the conventional EM benchmark.11
Figure 5: The Global Integration of Emerging Markets
Adjusted R2s from rolling regressions of hypothetical EM cap-quintile portfolio returns on global risk factor returns.

R-squareds from rolling 36-month regressions of hypothetical EM cap-quintile portfolio returns on market-based style and industry risk factor returns using a commercially available risk model. Universe: Stocks in EM IMI ex-China A-shares. Sources: Acadian, MSCI Copyright MSCI 2025, all rights reserved. Unpublished. PROPRIETARY TO MSCI. For illustrative purposes only. Past performance is no guarantee of future returns. Does not represent actual trading or an actual account or reflect transaction costs or advisory fees. Every investment program has an opportunity for loss as well as profit.
Figure 6: The Appeal of EM Small-Caps for Systematic Active Strategies
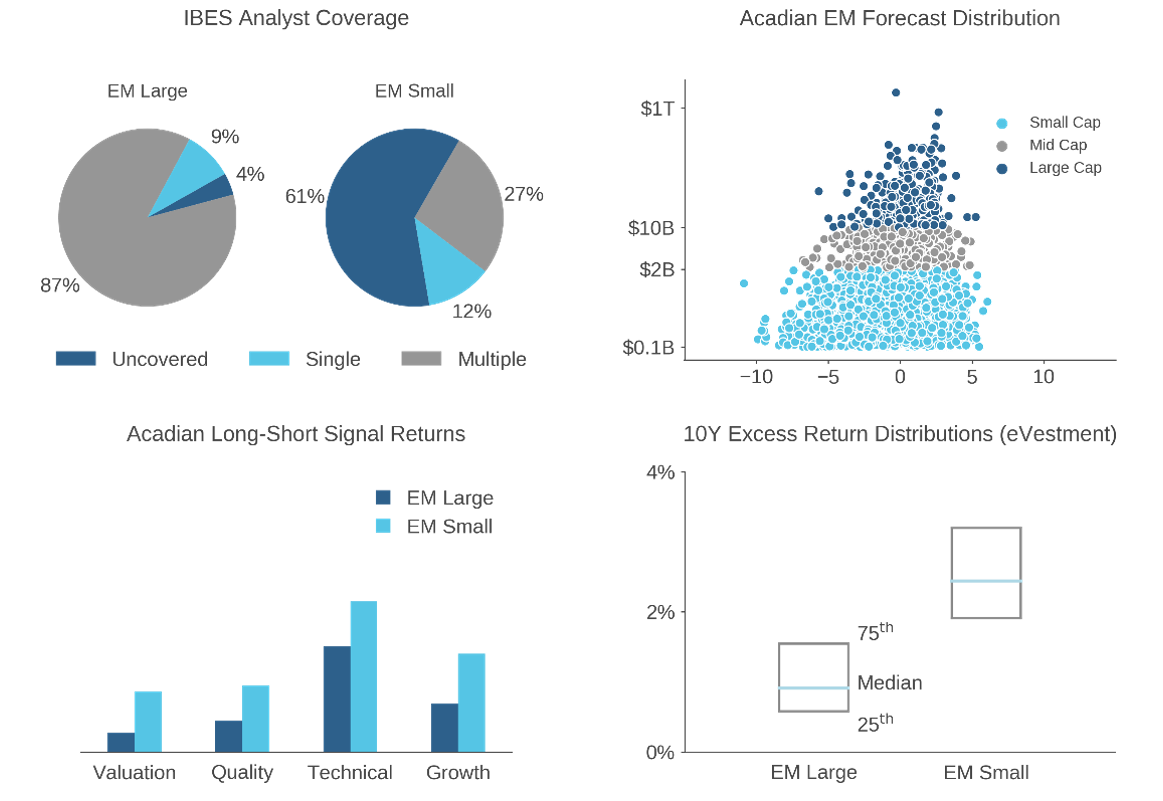
Top-left: Analyst coverage based on IBES next-year EPS estimates. Top-right: distribution of Acadian return forecasts for stocks with market cap above $100M in Acadian’s EM equity universe. Bottom-left: Annualized returns to Acadian long-short proprietary signals across large- and small-cap stocks in Acadian’s EM investment universe. Bottom-right: Distribution of active returns for strategies in eVestment’s EM equity universe by large- or small-cap style focus, relative to the MSCI EM and EM Small Cap Indexes, respectively. Sources of all charts: Acadian based on data from MSCI and eVestment. MSCI data copyright MSCI 2025, All Rights Reserved. Unpublished. PROPRIETARY TO MSCI. Please see additional eVestment disclosure at the end of the paper for more information. Past performance is no guarantee of future returns. Signal returns do not represent actual trading or an actual account, and they do not reflect transaction costs or advisory fees. Every investment program has an opportunity for loss as well as profit. For illustrative purposes only.
One way to do so is by embracing EM small caps, which remain less-well integrated with global equity markets, as evident in Figure 5. Figure 6 shows the benefit, tracing out a chain of evidence that EM small caps offer an especially attractive environment for stock selection, specifically via systematic methods:
Upper-left: The EM small-cap information environment is comparatively poor, as exemplified by analyst coverage.
Upper-right: That inferior information environment translates into greater pricing inefficiency. Greater dispersion in our proprietary alpha forecasts among small caps versus mid and large (compare the light-blue to the grey and dark-blue dots), indicates that small caps offer the most under- and over-priced stocks, seen through the lens of our forecasting models.
Lower-right: Consistent with the relative richness of that ex ante opportunity set, active managers have enjoyed greater success in EM small caps than in large, …
Lower-left: … and our proprietary systematic forecasting signals, specifically, exhibit relatively strong ex post efficacy among EM small caps.
In addition to embracing small caps, asset owners ought to weigh distinctiveness when choosing which markets to include in their EM investment universes. Within China, for example, A-shares stand out in terms of their “local character,” making the enormous and liquid onshore market an intriguing reservoir of stock-selection opportunity that may warrant emphasis relative to China’s offshore stocks, which are highly integrated with global markets.12 In EM ex-China, investors with the flexibility to do so might even consider opportunistically expanding their EM investment universes to include less-well-integrated slices of developed markets.13
Yet some asset owners reject an expansive EM investment universe out of discomfort with perceived risks, both financial and headline-related, of holding broad portfolios that include many small and unfamiliar companies. In the context of a systematic investing process, however, that reluctance is usually misguided for several reasons.
First, some such concerns are misplaced. For example, even though individual EM small-cap stocks tend to exhibit somewhat higher volatility than larger caps, a greater proportion of it is diversifiable in portfolio construction.14 Second, as discussed in the prior section, systematic methods are well designed to manage incremental risks. For example, they can limit exposure to individual issuers or groups thereof. Moreover, while in a long-only context, leaning into small-cap stocks necessarily entails exposure to a size risk factor, systematic portfolio construction affords flexibility and precision in controlling it. Finally, with respect to reputational risk, the analytical toolkit of systematic investing provides some broadly overlooked remedies. For example, we can apply natural language processing to identify emerging risk themes and to flag specific companies associated with them.
In fact, the instinct to restrict the EM investment universe is antithetical to the conceptual foundation of systematic investing, which is designed to exploit “breadth.” The idea is that the scalability of the systematic process increase portfolio risk-adjusted returns through application of the manager’s forecasting skill across a large number of independent “bets” without any weakening of model conviction.15 In the systematic investing context, therefore, we would expect limiting breadth to have a cost in terms of performance, which would manifest in lower expected returns or higher expected risk.16
Conclusion
The inefficiency of emerging markets offers fertile ground for stock selection, especially for asset owners willing to embrace an expansive investment universe. In making the best use of this opportunity set, a systematic approach offers a distinct edge, offering a unique blend of nuance and scalability in forecasting, portfolio construction and risk management. Together, these traits identify systematic active as a compelling approach to EM investing.