Anticipatable macro events, such as the upcoming U.S. presidential election, can generate considerable stock market volatility and widely varying impacts over the cross section of returns. Unfortunately, while the style factors in traditional risk models pick up on changes in volatilities and correlations produced by sustained macro trends, they do not well-capture risks associated with events and other shorter-term macro phenomena. In this paper, we demonstrate a practical method to supplement the predictions of multi-factor risk models, which allows investors to measure and, therefore, to reduce equity portfolio exposures to transient macro risks.
“Winner-Loser” Baskets as Macro Event Factors
Sell-side equity analysts and other subject-matter experts often publish winner and loser stock baskets in association with upcoming macro events. These baskets represent companies that the analysts expect to outperform and underperform depending on how circumstances play out. The transmission mechanisms between events and markets may be multifaceted and complex, perhaps involving shifts in demand for products and services, new regulations, and supply-chain disruptions, just to name a few possible channels.
Typically, winner and loser baskets comprise only limited sets of companies whose linkages to an event are most apparent. Nevertheless, we can extrapolate information from even narrow selections to inform estimates of event risk across much broader investment universes. In developing confidence in the resulting predictions, what matters is the reliability of the basket as an instrument to track market expectations regarding the likelihood and consequences of the event. If we can establish that confidence based on a combination of intuition and analysis, then we can apply the long-short basket to estimate portfolios’ active exposures to the upcoming event in question.
Measuring Portfolio Sensitivity to Macroeconomic Events
We can illustrate the approach to forecasting portfolio-level macro event risk using winner-loser baskets via an example: the 2020 U.S. presidential election.
Step 1: Choose a Winner-Loser Basket
To capture the impact of this event, Goldman Sachs created 1) the GSXUREPL Index, which consisted of 62 potential beneficiaries from a Republican policy agenda, and 2) the GSXUREPS Index, which consisted of 50 potential relative losers.
The outcome of a U.S. presidential election is likely to impact a broader universe of stocks than those companies included in such indexes, however. The stocks in these baskets represent only a small subset of U.S. public companies, but U.S. policy decisions stand to affect the operating environment of companies globally.
Step 2: Beta Neutralize the Basket
To make broader predictions about other stocks’ sensitivities based on these baskets, we first adjust a raw long-short winner-loser portfolio so that it is expected to be (ex ante) beta-neutral to the MSCI ACW Index (or any other appropriately broad market index). If we don’t, then we will not be able to distinguish whether portfolio-level sensitivities to the basket reflect exposure to the relevant theme or to directional market risk (beta).
Figure 1 shows results of this exercise in the context of the election example. It illustrates the performance of two illustrative winner-loser baskets. The left panel looks back to the 2020 election and shows the performance of a long-short basket of companies that at the time were expected to benefit and suffer (on a relative basis) from improving prospects for the Republican policy agenda. The right panel shows the performance of a 2024 election cycle Republican policy agenda basket described above.
Figure 1: Cumulative Returns of Hypothetical "Winner-Loser" Republican Policy Agenda Baskets

Source: Acadian based on index returns from Bloomberg. It is not possible to invest in any index. The above does not represent investment returns generated by actual trading or an actual portfolio. Hypothetical results are not indicative of actual future results. Investors have the opportunity for losses as well as profits. For illustrative purposes only.
Since subject-matter experts surely use observed stock price responses to emerging phenomena in constructing their long and short baskets, we apply background shading to differentiate “in-sample” versus “out-of-sample” performance (i.e., performance that informed the baskets’ construction from performance that might help in their validation). In each case, the charts exhibit out-of-sample performance that suggests the baskets indeed have value in tracking market assessments of the events and themes in question.
Step 3: Estimate Stocks’ Exposures to The Long-Short Basket
Given a (beta-adjusted) winner-loser basket, we can then apply a risk model to estimate stocks’ exposures to the theme across a broad investment universe. Risk models provide estimates of stock (and through aggregation, portfolio) volatilities and correlations with a benchmark—in this case the winner-loser long-short portfolio.
In predicting risk associated with macro catalysts, we generally opt for “short-term,” “statistical” risk models. Short-term refers to a model designed to forecast risk over a near-term horizon, e.g., days or weeks, which implies that its predictions should respond quickly and vigorously to changes in the environment. To achieve such responsiveness, parameters of short-term risk models are estimated from more recent and frequent market information than longer-horizon models, which smooth and dampen the influence of abrupt shifts.
Figure 2: Sensitivities to Hypothetical 2024 Republican Policy Agenda Basket among MSCI ACWI Index Constituents
Estimated based on data from 31-May-2024
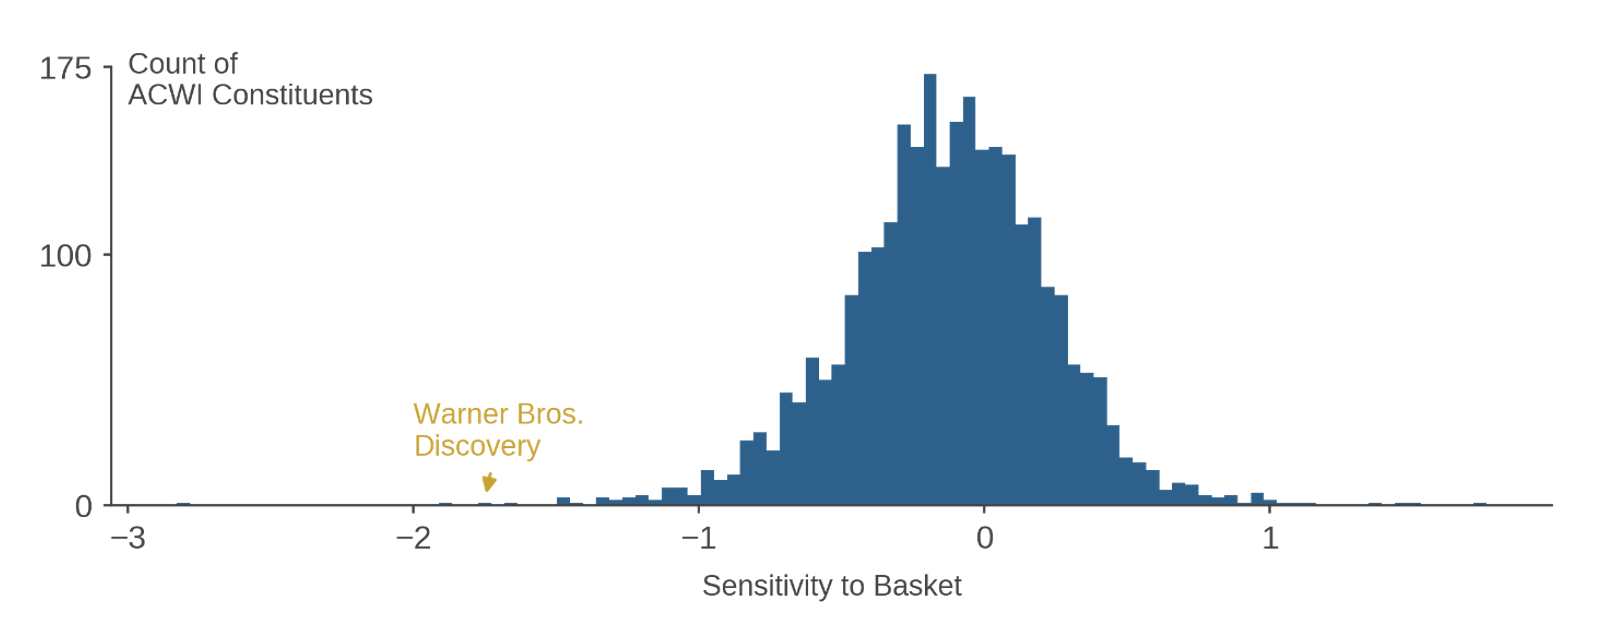
Source: Acadian based on index data from MSCI: MSCI data copyright MSCI 2024. All rights reserved. Unpublished. PROPRIETARY TO MSCI. For illustrative purposes only.
By a statistical risk model, we mean one that does not use preselected stock characteristics, such as market capitalization and price momentum, to define the systematic risk factors. Instead, they use statistical methods to impute risk factors (which are simply linear combinations of stocks) that explain commonalities in stocks’ returns. While these imputed risk factors may not be easy to interpret, statistical risk models are well-suited to pick up on transient sources of risk, which is especially valuable in the context of macro events.1
Companies that are constituents of the winner-loser basket drive explicit sensitivities to event outcomes. Companies that are linked to these outcomes via predicted correlations are interesting to explore and often are sensible. For instance, we find Warner Bros. Discovery, the owner of CNN, among the companies with the most negative predicted sensitivity to the 2024 Republican policy agenda long-short basket, even though it is not among the constituents named by subject matter experts.2 The linkage here is identified by statistical factors explaining co-movement, but we will leave it to the reader to intuit the explanation.
Step 4: Estimation of Active Portfolio Sensitivities
Based on estimated stock betas to the winner-loser basket across a full investment universe, we can readily estimate any active portfolio’s sensitivity to the event in question. Figure 3 illustrates, using a representative sample of Acadian client portfolios. For the 2024 election basket, we see that in the days after the Biden-Trump debate, portfolios with positive ex ante expected betas to the Republican Policy Agenda basket, as estimated on May 31st, outperformed those with negative betas.
Figure 3: Portfolio Active Returns Versus Ex Ante Estimated Active Betas to Hypothetical 2024 Republican Policy Agenda Basket
Representative sample of Acadian portfolios
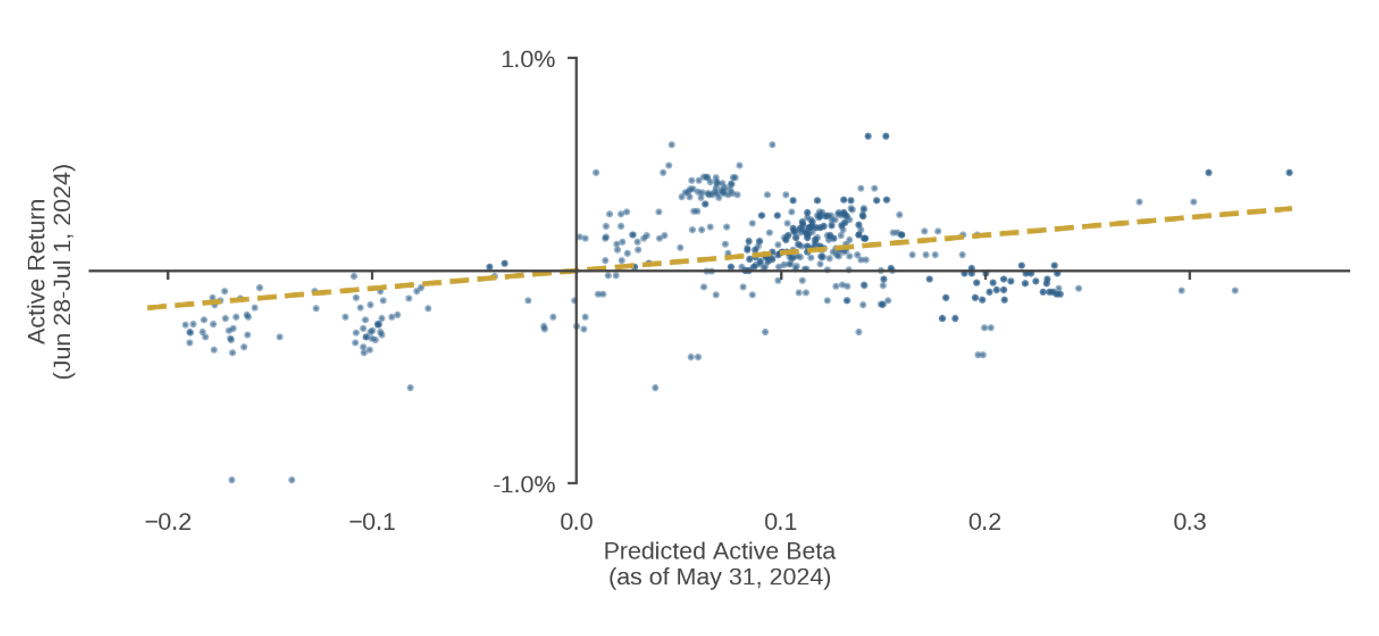
Source: Acadian. Portfolio performance is gross of fee. Past performance is not indicative of future results. Investors have the opportunity for losses as well as profits. For illustrative purposes only.
Conclusion
Traditional risk management tools are not, on their own, well-suited to capture the transient and irregular risks generated by macro events and abrupt changes in thematic trends. Nevertheless, we can judiciously apply them to extrapolate the narrow predictions of analysts who have deep context-specific expertise in order to understand thematic exposures across broad universes of stocks and, therefore, in active portfolios. Managers can use this information to weigh potential trading costs and loss of expected returns from closing active tilts associated with macro events and themes into which they do not have keen insight. Resulting portfolios may realize risks more consistent with ex ante predictions by multi-factor risk models informing portfolio construction. Active returns will be truer to manager stock selection skill rather than the impact of events of unknowable outcomes.