Float like a butterfly, fall like a brick: The impact of float on prices
Table of contents
QXO is a NASDAQ stock with a price that reached $290 in June and then fell to around $12 in early August.[1] Market capitalization fell from $119B to $5B, a decline of $114B. How should we think about this event? Did someone destroy $114B? Did someone get $114B poorer?
No, nobody lost $114B and the fall in value was mostly a non-event because the June market capitalization was mostly meaningless. In this post, I’ll explain my definition of “meaningless” when it comes to market prices.
The amazing story of QXO (involving various personalities such as Jared Kushner) has been covered in detail by the indispensable Matt Levine,[2] so let me just give a few facts:
- QXO has assets largely consisting of $4.5 billion of cash.
- Prior to July 29, only 0.1% of the shares were publicly trading, with the other 99.9% held by large investors, some of whom were legally unable to sell.
- On June 13, QXO sold additional shares to institutional investors for $9.14 at a time when the market price was around $205.
- After July 29, some existing large investors were allowed to sell for the first time. The price fell from $60 to $12 in four days.
There are many surprising things about these events.
First, assets worth $4.5B should not be trading for $119B. QXO seemed to violate the Law of One Price (LOOP), as argued by Spencer Jakab.[3] I’ve previously discussed LOOP in the context of closed-end funds. You could see QXO as a closed-end fund with a premium of 2,544% ($119 vs. $4.5), which is higher than the record-breaking premium of the Destiny Tech100 Fund.
Second, it is surprising that some market actors could buy shares for $9.14 on the same day that others were willing to pay $205.
Third, it was predictable that (due to the overpricing) shares would eventually be sold once QXO made the necessary SEC filing, which it did on July 29. Stock prices should not drop when predictable events occur.
In addition to having a very high valuation in July, QXO had very high shorting costs. Why didn’t short sellers sell prior to July 29 and then make profits as the price fell predictably? Because it was expensive to borrow the shares.
The cost of shorting QXO was high. How high? Mind-blowingly, draw-droppingly, head-spinningly, record-breakingly high. According to Interactive Brokers, the cost of shorting was 4,815% on July 31. Back in May, I discussed “The incredible cost of short selling” and bemoaned the fact that costs were sometimes above 1,000%. It appears that since then, costs have gotten even more incredible. To the best of my knowledge, 4,815% is the highest short fee in recorded human history.
One reason it was costly to short is because 99.9% of the shares were held by investors who presumably won’t/can’t lend shares. This leads me to the topic of float. Different people have different definitions of float, but it generally means the number of shares that are available to trade in the market, as opposed to shares being held by insiders who won’t/can’t sell. QXO had a float of 0.1% of shares outstanding.
Float is a subset of the broader concept of share supply. There are two ways that the number of tradeable shares of QXO can increase: the company can issue more shares (shares outstanding rises), or some of the existing shares currently held by insiders can be sold (float rises).
While low float was one reason that shorting was expensive, I think it’s more accurate to say that shorting was expensive because QXO was overpriced, and QXO was overpriced because it had low float. In situations with extreme low float, we often observe absurdly high prices that imply meaningless market capitalizations. This brings me to my definition of “meaningless.”
The economics of meaninglessness
The term “meaningless” was used by Garber (2001) to describe the Tulipmania of the 1630s:
these markets consisted of a collection of people without equity making ever-increasing numbers of 'million dollar bets' with one another with some knowledge that the state would not enforce the contracts. This was no more than a meaningless winter drinking game, played by a plague-ridden population.
Here’s my definition of “meaningless.” A share price is economically meaningful at the $X level if you can sell $X worth of shares without greatly decreasing the share price. Otherwise, it’s meaningless at the $X level. A price is “totally meaningless” if you are unable to sell any shares at that price. Market cap is meaningful at the Y% level if you can sell Y% of the shares outstanding without greatly decreasing the market cap.
Of course, I’ve skipped many details (are you selling over multiple days? what does “greatly decreasing” mean?) but you get the idea. A meaningful price is a price that does not change much if you try to sell (elastic demand; market impact is low).
So comparing QXO with Tesla, I would say that in June 2024, Tesla’s market cap of roughly $630B was meaningful at the 5% level, but QXO’s market cap of $119B was meaningless at the 5% level. Of course, a proper analysis would examine volume, trading costs, and so forth, but I am comfortable with my assertion. One clue that the market price was meaningless is the fact that QXO privately issued shares at $9.14 when the market price was $205.
One way to think about QXO as of June 2024 is that it had a market cap of $119B but a float of only $119M, so QXO was a large cap stock with a microcap float and was acting like a microcap stock.
Why is float important? What’s the causal mechanism? Let’s go to the parable of the envelopes.
The parable of the envelopes
Consider the following valuation question. I take a crisp $100 bill. I place it in an envelope. I then sell this envelope on the open market. What is the market price?
Here's my claim. While we all agree that the rational value is $100, the actual market outcome will depend on the quantity of envelopes that I offer to the market.
Suppose I take a million envelopes, and stuff each one with $100 in currency. I will call these envelopes “shares” and list them on the stock market as interchangeable objects representing a single issuer with shares outstanding of 1M. If I sell all 1M envelopes on the market, we can say float = 1M. When float = 1M, I’d expect the equilibrium price to be $100 per envelope and total market cap to be $100M (perhaps with a small haircut for processing the physical cash). In this scenario, $100 is a genuine, economically meaningful price.
Now suppose I decide to sell only one envelope, retaining the other 999,999 envelopes to sell later. Float = 1 envelope. In this scenario, the price might be something above $100, maybe $200. That's a crazy price, obviously, but possible. It might be an equilibrium market outcome, but is it meaningful? I’d say no.
Let’s get specific. Meet Nandor the Noise Trader. There are two things you need to know about Nandor. First, he has $200 in wealth. Second, he is insane, or at least he has the insane strategy of always valuing envelopes at 2X their true worth.
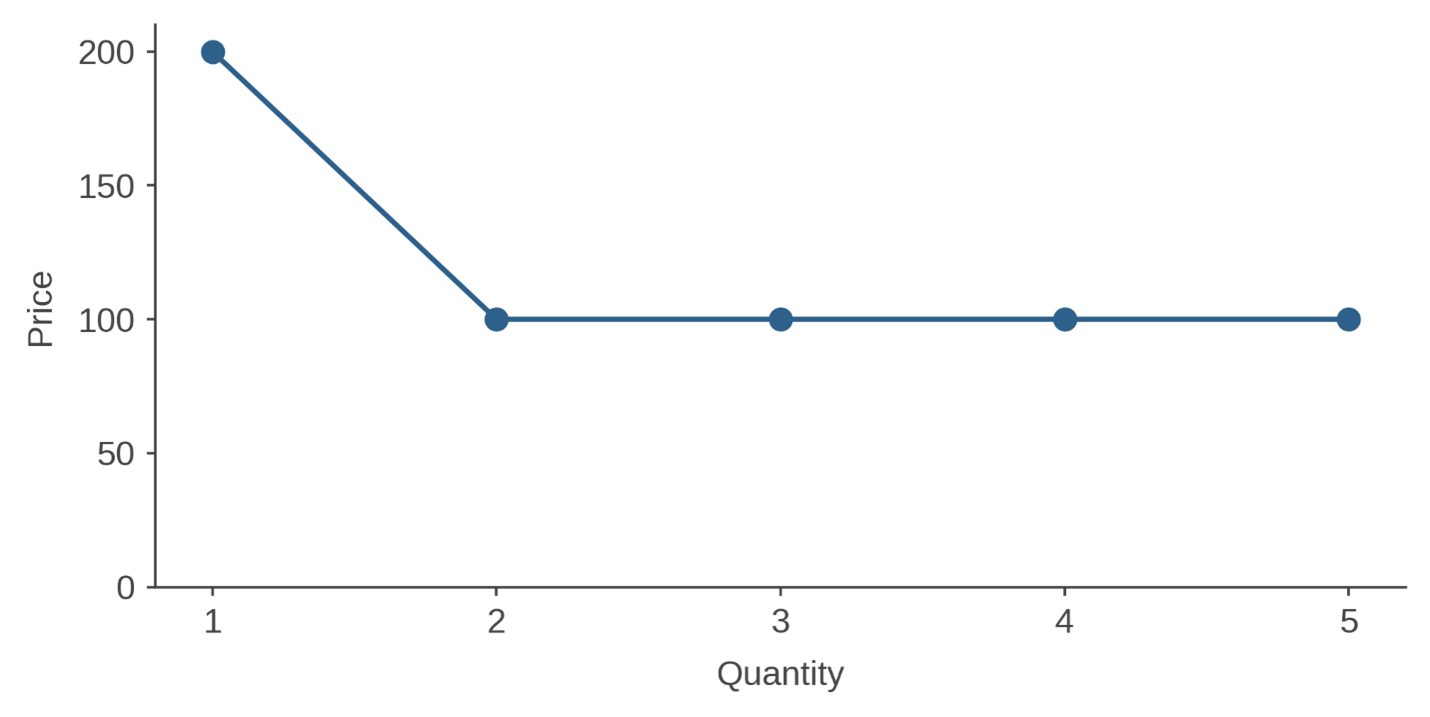
So, now you can see that if float = 1 and Nandor is present, we arrive at a price of $200. If I sell three envelopes (float = 3), Nandor becomes less relevant, as I sell the first envelope to him for $200 and the other two at $100 to rational traders. We have an extremely simple downward sloping demand curve.
Consider the situation where float = 1 and I have just sold one envelope to Nandor for $200. At this moment, we will observe the following:
- Last price: $200
- Bid price: $100 (bids by rational people)
- Ask price: $200 (offer from Nandor)
In my view, the price of $200 is totally meaningless; it has no quantitatively significant implications or impact on anything.
What else can we say about the $200 price?
- This price is not fake. It is a genuine price reflecting market equilibrium. Supply and demand have successfully interacted.
- This price (or at least this constellation of bid/ask prices) is efficient in the sense that there is “no free lunch” and “no arbitrage opportunities.” I as the issuer am making money on the first envelope I sell, but once I have sold to Nandor, there are no exploitable mispricings remaining for anyone including me. I have no incentive to sell a second envelope and drive the price down to $100; I would not profit from this transaction.
- This price is totally meaningless. It doesn't tell us anything about the value of what’s inside the envelope, nor does it give the issuer (me) an incentive to create more envelopes, because there is only one Nandor out there with only $200 to spend. When I sell the first envelope, it is a pure transfer of $100 from Nandor to me. Now, this transaction may make us both better off (perhaps Nandor enjoys his insane strategy), but I can’t say that $100 is a meaningful amount.
- The official market cap of my million envelopes is $200M while the actual value is only $100M. Am I a genius who turned $100M into $200M? No. The $200M market cap is totally meaningless. I have not made $100M by selling to Nandor; I have only made $100 from Nandor and the $100M increase is illusory.
We could also jazz up this story a little. Suppose Nandor has a friend, Nadja. Nadja is willing to pay $300 for an envelope when the wind is blowing south, but $150 when the wind is blowing north. If float = 1, Nandor and Nadja may trade with each other, with the price fluctuating depending on wind direction. It may not be worthwhile for rational traders to enter this market and arbitrage the mispricing, depending on the amount of money that Nandor and Nadja have to spend. I, the issuer, should sell more envelopes once Nadja appears on the scene, but if I am unable to sell for legal reasons in the short term, perhaps Nandor and Nadja reign supreme.
If I move from a situation where float = 1 to float = 1M, the market price will fall to $100. Both Nandor and Nadja will buy as much as they can but will have no impact on anything.
Here are the implications of this simple-minded model involving Nandor and Nadja:
- Low float creates high volatility.
- Low float creates high prices.
- When float rises, both price levels and volatility fall.
As we go from 1 envelope on the market to 1M envelopes, it is not really important whether we call this “float” or “issuance.” The important thing is the number of envelopes trading. I could start with 1 share outstanding and then issue 999,999 more; or I could start with 1M shares outstanding and one floating. The key is the supply of shares. Supply goes up, price goes down.
How does this scenario relate to efficient markets and rational asset pricing? In the classic view, the demand curve is always perfectly flat and there is no scope for Nandor to impact valuations. So one defense of the classic view is to say: the downward-sloping part of the demand curve is tiny and unimportant. Nandor’s shenanigans are meaningless and we should ignore them.
My own view is that there can be prices that are wrong but also meaningful. Going back to the example of Tesla, when I say that Tesla’s valuation is meaningful, I am not trying to say that it is correct or rational; I’m just trying to say that you could have traded meaningful amounts at that price (in contrast, the price of QXO was neither rational nor meaningful).
There are some stocks out there that are pretty close to being envelopes of cash. A SPAC is an envelope of cash (it changes into a regular firm in the de-SPAC phase). A closed-end fund is an envelope of cash (or at least securities). And QXO right now is pretty much an envelope containing cash.
So what’s the deal with QXO? The deal is that Nandor and Nadja were setting the price prior to July 29. We see massive overpricing and volatility. The market cap was maybe a tiny bit meaningful (someone was selling and someone was buying; volume was not zero) but not far from totally meaningless. Once the large investors were able to sell, we move to the flat part of the demand curve, and prices become more meaningful.
Float goes up, price goes down. It is a simple story. It is a stupid story. But it is a true story.
Research on low float and overpricing
My parable of the envelopes omits many important elements, including the actions of rational traders interacting with Nandor and Nadja, and how these rational traders think about future float increases. I’ve previously discussed the idea of a “speculative premium” where disagreement + short-sale constraints = overpricing; this dynamic is amplified by low float according to Hong, Scheinkman and Xiong (2006).
Academic research has identified many cases where low float leads to volatility and overpricing. Often they involve identifiable LOOP violations as well as short-sale constraints. Cases include:
- The Palm/3Com case studied by Lamont and Thaler (2003), where the eventual distribution of Palm shares increased the Palm float and eliminated the overpricing.
- The tech stock bubble of 1999/2000 studied by Ofek and Richardson (2003), where expiring lockup provisions on IPOs increased the float of internet stocks and helped end the bubble in early 2000.
- Various cases in the Chinese stock market such as the warrants studied by Xiong and Yu (2011).
I am not saying that these were cases of meaningless prices; many fortunes were made and lost on internet stocks in 1999/2000, and it was certainly possible to trade large amounts of dollars. But these were cases where low float allowed crazy prices.
In recent years we’ve seen a handful of extreme cases with:
- Very low float as a percent of market cap.
- Bafflingly high prices.
- Very high price volatility.
In many of these cases, the stocks involved were newly listed entities that did not have a traditional IPO but instead entered the market by direct listing or (like QXO) through an existing listed entity such as a SPAC. Recent examples include:
- Low-float SPACs in February 2022. Bloomberg headline: “Speculators Drive 700% Jump in Former SPACS with Low Floats.”[4]
- AMTD Digital in August 2022. Bloomberg headline: “This Tiny Firm Just Surpassed Goldman Sachs With a 14,000% Gain” with text “It’s a mystery why the stock has surged, though some analysts have pointed to its tiny public float.”[5]
- Vinfast in August 2023. Price rose 6X after initial listing. Float was 1% of shares outstanding.
These cases had prices that seemed meaningless (especially AMTD, where trading volume was low on the days when the price was extremely high).
Let’s conclude by imagining the following scenario. Suppose you tell me that XYZ has a market cap of $10T but a float of only $10M. You say that XYZ has valuation and volatility that are crazy high, and you’re outraged that XYZ has a market cap higher than Apple or Nvidia.
My response is to shrug. XYZ’s valuation is not a searing indictment of the efficient market hypothesis; instead, it’s close to meaningless. I would not be super concerned about the pricing of a firm with a $10M market cap, so why should I be concerned about a firm with a $10M float? As long as everyone knows that XYZ’s market cap is meaningless and no one makes any actual decisions based on it, let Nandor and Nadja have their fun. It won’t last long.
Endnotes
[1] References to this and other companies should not be interpreted as recommendations to buy or sell specific securities. Acadian and/or the author of this post may hold positions in one or more securities associated with these companies.
[2] Levine, Matt. “Bill Ackman Raised No Money,” Bloomberg, August 1, 2024.
[3] Jakab, Spencer. “The Stock That Took Investors on a $90 Billion Ride,” The Wall Street Journal, August 2, 2024.
[4] Lipschultz, Bailey. “Speculators Drive 700% Jump in Former SPACS with Low Floats.” Bloomberg, February 17, 2022.
[5] “This Tiny Firm Just Surpassed Goldman Sachs With a 14,000% Gain.” Bloomberg, August 3, 2022.
References
Garber, Peter M. Famous first bubbles: The fundamentals of early manias. MIT Press, 2001.
Hong, Harrison, Jose Scheinkman, and Wei Xiong. "Asset float and speculative bubbles." The Journal of Finance 61, no. 3 (2006): 1073-1117.
Lamont, Owen A., and Richard H. Thaler. "Can the market add and subtract? Mispricing in tech stock carve-outs." Journal of Political Economy 111, no. 2 (2003): 227-268.
Ofek, Eli, and Matthew Richardson. "Dotcom mania: The rise and fall of internet stock prices." The Journal of Finance 58.3 (2003): 1113-1137.
Xiong, Wei, and Jialin Yu. "The Chinese warrants bubble." American Economic Review 101, no. 6 (2011): 2723-2753.
Legal Disclaimer
These materials provided herein may contain material, non-public information within the meaning of the United States Federal Securities Laws with respect to Acadian Asset Management LLC, Acadian Asset Management Inc. and/or their respective subsidiaries and affiliated entities. The recipient of these materials agrees that it will not use any confidential information that may be contained herein to execute or recommend transactions in securities. The recipient further acknowledges that it is aware that United States Federal and State securities laws prohibit any person or entity who has material, non-public information about a publicly-traded company from purchasing or selling securities of such company, or from communicating such information to any other person or entity under circumstances in which it is reasonably foreseeable that such person or entity is likely to sell or purchase such securities.
Acadian provides this material as a general overview of the firm, our processes and our investment capabilities. It has been provided for informational purposes only. It does not constitute or form part of any offer to issue or sell, or any solicitation of any offer to subscribe or to purchase, shares, units or other interests in investments that may be referred to herein and must not be construed as investment or financial product advice. Acadian has not considered any reader's financial situation, objective or needs in providing the relevant information.
The value of investments may fall as well as rise and you may not get back your original investment. Past performance is not necessarily a guide to future performance or returns. Acadian has taken all reasonable care to ensure that the information contained in this material is accurate at the time of its distribution, no representation or warranty, express or implied, is made as to the accuracy, reliability or completeness of such information.
This material contains privileged and confidential information and is intended only for the recipient/s. Any distribution, reproduction or other use of this presentation by recipients is strictly prohibited. If you are not the intended recipient and this presentation has been sent or passed on to you in error, please contact us immediately. Confidentiality and privilege are not lost by this presentation having been sent or passed on to you in error.
Acadian’s quantitative investment process is supported by extensive proprietary computer code. Acadian’s researchers, software developers, and IT teams follow a structured design, development, testing, change control, and review processes during the development of its systems and the implementation within our investment process. These controls and their effectiveness are subject to regular internal reviews, at least annual independent review by our SOC1 auditor. However, despite these extensive controls it is possible that errors may occur in coding and within the investment process, as is the case with any complex software or data-driven model, and no guarantee or warranty can be provided that any quantitative investment model is completely free of errors. Any such errors could have a negative impact on investment results. We have in place control systems and processes which are intended to identify in a timely manner any such errors which would have a material impact on the investment process.
Acadian Asset Management LLC has wholly owned affiliates located in London, Singapore, and Sydney. Pursuant to the terms of service level agreements with each affiliate, employees of Acadian Asset Management LLC may provide certain services on behalf of each affiliate and employees of each affiliate may provide certain administrative services, including marketing and client service, on behalf of Acadian Asset Management LLC.
Acadian Asset Management LLC is registered as an investment adviser with the U.S. Securities and Exchange Commission. Registration of an investment adviser does not imply any level of skill or training.
Acadian Asset Management (Singapore) Pte Ltd, (Registration Number: 199902125D) is licensed by the Monetary Authority of Singapore. It is also registered as an investment adviser with the U.S. Securities and Exchange Commission.
Acadian Asset Management (Australia) Limited (ABN 41 114 200 127) is the holder of Australian financial services license number 291872 ("AFSL"). It is also registered as an investment adviser with the U.S. Securities and Exchange Commission. Under the terms of its AFSL, Acadian Asset Management (Australia) Limited is limited to providing the financial services under its license to wholesale clients only. This marketing material is not to be provided to retail clients.
Acadian Asset Management (UK) Limited is authorized and regulated by the Financial Conduct Authority ('the FCA') and is a limited liability company incorporated in England and Wales with company number 05644066. Acadian Asset Management (UK) Limited will only make this material available to Professional Clients and Eligible Counterparties as defined by the FCA under the Markets in Financial Instruments Directive, or to Qualified Investors in Switzerland as defined in the Collective Investment Schemes Act, as applicable.
About the Author
