Revealing Style: What Fund Flows Say about Investor Preferences for Value and Growth
Key Takeaways
- Vanguard launched the first value- and growth-labeled index funds in 1992. While value index funds initially attracted more assets, growth index funds have consistently held a market share advantage.
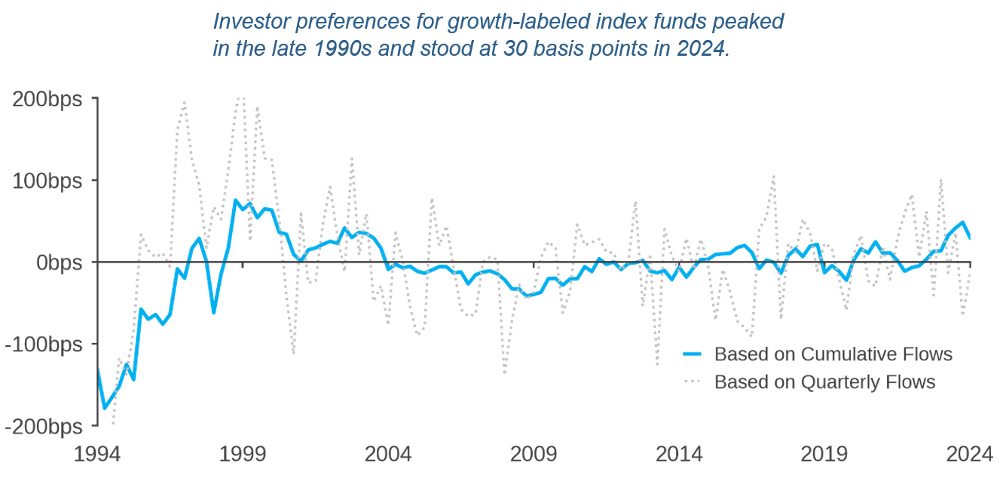
- From investor flows, we infer that investors believed growth index funds would deliver returns up to 75 basis points higher per year than value funds, with that figure standing at 30 basis points in March 2024.
- Investor beliefs about future returns have not been useful predictors of future returns. When growth expectations have been relatively high, subsequent returns on Russell 1000 growth stocks have been relatively low.
Table of contents
The Origins of Index Investing
The first Vanguard index fund launched in August 1976 with the goal of closely tracking the return of the S&P 500 at the lowest possible cost. The product’s rationale reflected the prevailing academic theory of the time—market efficiency. If markets are efficient, beating the market consistently by picking individual stocks is unlikely, so holding the overall market cheaply is appealing.
Yet research in the 1980s revealed patterns of return predictability. Small stocks often outperformed large, and “value” stocks—defined by low prices relative to earnings, book value, or past prices—often outperformed “growth” stocks. The academic research that identified these return patterns reinforced systematic portfolio strategies that had already existed in discretionary form. Value investing, for instance, dates at least to Graham and Dodd in 1934, and growth investing gained attention through Fisher in 1958.
Gene Fama and Ken French summarized a decade of work by proposing factors that captured small-cap and value outperformance, but they labeled them as “factors” rather than “mispricings.” The idea was that small and value stocks earned higher returns because they were riskier, preserving the notion of market efficiency.
The Advent of Style Indexing
With this backdrop, Russell invented passive style indexes in 1987, and Vanguard introduced investable style index funds soon after in 1992. Russell’s initial rationale was benchmarking:1 consulting clients who hired active managers needed to know if outperformance was due to genuine stock-picking skill or merely to a bias toward value or growth stocks. If a manager’s tilt toward either style could explain their returns, that was important information for evaluating skill.
Russell also anticipated that value and growth indexes might become investment products. Investors could either capitalize on “the expected long-term outperformance of value stocks” or take a tactical preference for growth if they believed growth would outperform over certain periods. In addition, investors could employ a style fund to complete their portfolios, neutralizing any unintentional bias or “hole” left by active managers.
When Vanguard launched its style index funds in 1992, this pair of funds allowed investors to express a preference for one style or the other. John Bogle later “bemoaned his progeny,”2 believing that these funds tempted investors to chase whichever style had recently performed better. The growth of these style-labeled index funds has been dramatic. From modest beginnings, value- and growth-labeled funds now total nearly $1.6 trillion in net assets. A significant portion of these assets reside with eight major fund complexes, including Vanguard and BlackRock, and most are in ETFs rather than traditional mutual funds.
Inferring Investor Beliefs from Their Investment Choices
Over the decades, investors have strongly favored growth-labeled index funds over value-labeled ones. Although value had early academic support, flows and assets under management had shifted decisively toward growth by the late 1990s and have mostly remained that way ever since.
In recent years, financial economists have increasingly used methods from industrial organization to study how consumers select financial products.3 In that spirit, it is natural to use the market for index funds to infer investor beliefs about future returns on value- versus growth-labeled index funds. A simple regression links each fund’s market share (or cumulative flows) to its expense ratio, past performance, and an indicator of whether it is labeled “value” or “growth.” From this, one can infer time-varying estimates of how much higher (or lower) investors believe growth fund returns will be relative to value fund returns.4
Figure 1 presents the results for the traditional mutual fund subsample. These beliefs peaked at about 75 basis points per year in the late 1990s. By early 2024, they had settled at around 30 basis points. This implies that investors collectively expect growth stocks to outperform value stocks by roughly 0.30% per year, based on how they allocate their money.
Figure 1: Investor Preferences for Value and Growth-Labeled Index Funds
Preference for growth funds over value funds versus historical average, measured in basis points of return per year
Rational Expectations or Sentiment?
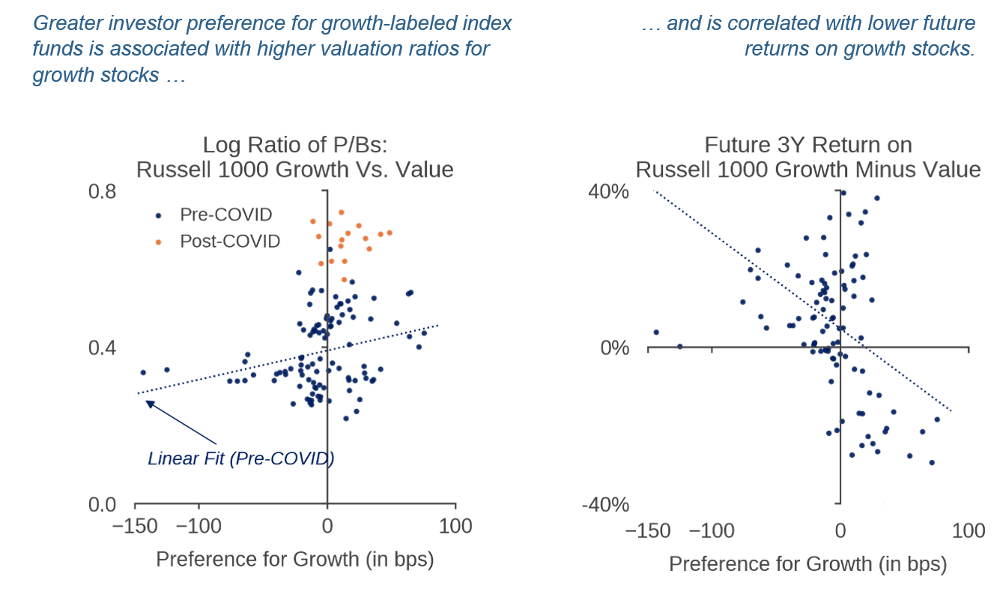
The accuracy of beliefs in Figure 1 has been mixed at best. Past peaks in preferences for growth have coincided with high valuations for growth stocks, followed by stretches of underperformance relative to value. Figure 2 helps to illustrate this dynamic.5 It plots the inferred ex ante beliefs from Figure 1 (how strongly investors favor growth) against two ex post variables: the relative valuations of growth stocks and their subsequent returns versus value stocks. If investors were rationally anticipating higher future returns, we might see strong performance by growth stocks when investors’ beliefs about growth are favorable. Instead, the correlation points in the opposite direction, suggesting that “sentiment for growth” is a more fitting description of investor beliefs than “useful predictions for growth returns.”
Figure 2: Valuations and Future Returns as Functions of Preferences for Growth Funds
Why Do Anomalies Persist?
An enduring question in financial economics is why anomalies—like the historical outperformance of value— persist after discovery. They might not if rational investors “arbitrage” the anomalies—trading against mispricings, buying what is cheap and underpriced, selling what is overpriced, and in the process causing the anomaly to vanish.
Some facts here align with that logic. When Russell and Vanguard introduced value-labeled index funds in 1992, investors indeed favored them early on, presumably in response to evidence of value’s higher average returns. For most of the last thirty years, however, investors favored growth, pushing growth stock valuations higher and leaving value stocks cheaper still. The invention of style index funds has had a perverse effect: rather than eliminating mispricing, the ubiquity of growth-labeled index funds has arguably increased the divergence in valuations, helping growth remain expensive relative to value.
Conclusion
Vanguard launched a pair of index funds in 1992, inspiring many imitators and giving us more than thirty years of data to examine investor beliefs about the returns to value and growth. After an initial market share advantage, investors have reliably preferred growth to value, measured either by the share of assets under management or cumulative flows. Our estimates of investor beliefs about the relative returns to growth peak at 75 basis points per annum in 1999 and now stand at 30 basis points. Those past beliefs have not been predictive of future returns and are more plausibly labeled as “sentiment” for growth and value.
References
Barnes, M., Russell Growth and Value Indexes: The enduring utility of style, Russell Investments, 2021.
Egan, M., A. J. MacKay, and H. Yang, “Recovering investor expectations from demand for index funds.” Review of Economic Studies 89, no. 5 (2022): 2559–2599.
Fama, E. F. and K. R. French, “The cross-section of expected stock returns.” Journal of Finance 47, no. 2 (1992): 427–465.
Fisher, P. A., “Common Stocks and Uncommon Profits,” (Harper & Brothers, 1958).
Graham, B. and D. L. Dodd, “Security Analysis,” (McGraw-Hill, 1934).
Rekenthaler, J., Vanguard’s other index-fund invention: Should Jack Bogle have lamented his subsequent creation?, Morningstar, May 27, 2022.
Endnotes
- Discussion of Russell's motivations is based on Barnes (2021).
- See Rekenthaler (2022), for example.
- See Egan, MacKay and Yang (2022), for an example.
- The longer version of this piece, Investor Sentiment for Value and Growth, Acadian, December 2024, describes the methodology in detail.
- The longer version of this piece considers the wealth loss to Vanguard investors specifically from poor timing across growth and value (estimated to be a modest 29 basis points per year over the full period) and poor market timing of flows into growth versus value funds (estimated to be 74 basis points per year worse for growth investors).
Hypothetical
Acadian is providing hypothetical performance information for your review as we believe you have access to resources to independently analyze this information and have the financial expertise to understand the risks and limitations of the presentation of hypothetical performance. Please immediately advise if that is not the case.
Hypothetical performance results have many inherent limitations, some of which are described below. No representation is being made that any account will or is likely to achieve profits or losses similar to those shown. In fact, there are frequently sharp differences between hypothetical performance results and the actual performance results subsequently achieved by any particular trading program.
One of the limitations of hypothetical performance results is that they are generally prepared with the benefit of hindsight. In addition, hypothetical trading does not involve financial risk, and no hypothetical trading record can completely account for the impact of financial risk in actual trading. For example, the ability to withstand losses or to adhere to a particular trading program in spite of trading losses are material points which can also adversely affect actual trading results. There are numerous other factors related to the markets in general or to the implementation of any specific trading program which cannot be fully accounted for in the preparation of hypothetical performance results and all of which can adversely affect actual trading results.
Don't miss the next Acadian Insight
Get our latest thought leadership delivered to your inbox
Legal Disclaimer
These materials provided herein may contain material, non-public information within the meaning of the United States Federal Securities Laws with respect to Acadian Asset Management LLC, Acadian Asset Management Inc. and/or their respective subsidiaries and affiliated entities. The recipient of these materials agrees that it will not use any confidential information that may be contained herein to execute or recommend transactions in securities. The recipient further acknowledges that it is aware that United States Federal and State securities laws prohibit any person or entity who has material, non-public information about a publicly-traded company from purchasing or selling securities of such company, or from communicating such information to any other person or entity under circumstances in which it is reasonably foreseeable that such person or entity is likely to sell or purchase such securities.
Acadian provides this material as a general overview of the firm, our processes and our investment capabilities. It has been provided for informational purposes only. It does not constitute or form part of any offer to issue or sell, or any solicitation of any offer to subscribe or to purchase, shares, units or other interests in investments that may be referred to herein and must not be construed as investment or financial product advice. Acadian has not considered any reader's financial situation, objective or needs in providing the relevant information.
The value of investments may fall as well as rise and you may not get back your original investment. Past performance is not necessarily a guide to future performance or returns. Acadian has taken all reasonable care to ensure that the information contained in this material is accurate at the time of its distribution, no representation or warranty, express or implied, is made as to the accuracy, reliability or completeness of such information.
This material contains privileged and confidential information and is intended only for the recipient/s. Any distribution, reproduction or other use of this presentation by recipients is strictly prohibited. If you are not the intended recipient and this presentation has been sent or passed on to you in error, please contact us immediately. Confidentiality and privilege are not lost by this presentation having been sent or passed on to you in error.
Acadian’s quantitative investment process is supported by extensive proprietary computer code. Acadian’s researchers, software developers, and IT teams follow a structured design, development, testing, change control, and review processes during the development of its systems and the implementation within our investment process. These controls and their effectiveness are subject to regular internal reviews, at least annual independent review by our SOC1 auditor. However, despite these extensive controls it is possible that errors may occur in coding and within the investment process, as is the case with any complex software or data-driven model, and no guarantee or warranty can be provided that any quantitative investment model is completely free of errors. Any such errors could have a negative impact on investment results. We have in place control systems and processes which are intended to identify in a timely manner any such errors which would have a material impact on the investment process.
Acadian Asset Management LLC has wholly owned affiliates located in London, Singapore, and Sydney. Pursuant to the terms of service level agreements with each affiliate, employees of Acadian Asset Management LLC may provide certain services on behalf of each affiliate and employees of each affiliate may provide certain administrative services, including marketing and client service, on behalf of Acadian Asset Management LLC.
Acadian Asset Management LLC is registered as an investment adviser with the U.S. Securities and Exchange Commission. Registration of an investment adviser does not imply any level of skill or training.
Acadian Asset Management (Singapore) Pte Ltd, (Registration Number: 199902125D) is licensed by the Monetary Authority of Singapore. It is also registered as an investment adviser with the U.S. Securities and Exchange Commission.
Acadian Asset Management (Australia) Limited (ABN 41 114 200 127) is the holder of Australian financial services license number 291872 ("AFSL"). It is also registered as an investment adviser with the U.S. Securities and Exchange Commission. Under the terms of its AFSL, Acadian Asset Management (Australia) Limited is limited to providing the financial services under its license to wholesale clients only. This marketing material is not to be provided to retail clients.
Acadian Asset Management (UK) Limited is authorized and regulated by the Financial Conduct Authority ('the FCA') and is a limited liability company incorporated in England and Wales with company number 05644066. Acadian Asset Management (UK) Limited will only make this material available to Professional Clients and Eligible Counterparties as defined by the FCA under the Markets in Financial Instruments Directive, or to Qualified Investors in Switzerland as defined in the Collective Investment Schemes Act, as applicable.
Biography
