Rising Tiger, Falling Dragon: Theme Du Jour in EM Equity Investing
Key Takeaways
- "Rising Tiger, Falling Dragon,” i.e., long India, short China, has become the latest emerging markets (EM) equity investing theme.
- Macro thematic investing in EM is risky and restrictive, however. Trades that come into vogue, like Rising Tiger, Falling Dragon, are often superficially based—reflective of past price trends—and vulnerable to sudden reversals of sentiment.
- We would encourage EM investors to resist latching on to this latest theme, and instead to stay invested in EM through diversified active strategies. To find opportunities, cast a wide net across the full EM universe, and employ an information set that extends well beyond just the macroeconomic picture.
Table of contents
While investors have been enthralled by the recent surge in Indian stocks, they have been disappointed by three years of struggles with Chinese equities. The divergent performance between these two countries’ stocks has birthed a theme that we call “Rising Tiger, Falling Dragon.” However, this is only the latest in a series of popular emerging markets (EM) themes, many of which have initially captivated but later frustrated investors. Past memes, such as the BATTS, offer valuable reminders of the risks inherent in chasing macro themes in EM and the shortcomings of their typical implementations. Instead, we would encourage EM investors to stay broadly invested, and to embrace active strategies that cast a wide net over the full investment universe and identify opportunities based on much richer information than just the macro picture.
EM Theme Du Jour
Rising Tiger, Falling Dragon has become the EM investing theme du jour. At a superficial level, the thesis makes sense, because the underlying sentiment that it captures is consistent with the macro picture. From an economic perspective, India and China appear to be at polar extremes. China, at one end of the spectrum, faces headwinds from the 3Ds – Debt, Demographics, and Deglobalization. The same factors seem poised to benefit India – no debt overhang that could inhibit economic growth, a growing working age population, and an emerging destination for global corporates seeking to diversify their supply chains (reglobalization).
But divergent macro trajectories do not necessarily imply a promising investment opportunity. Economic optimism about India and pessimism about China are broadly reflected in market valuations. Indian equities trade at a substantial premium to fundamentals, close to what we are seeing in the U.S. (Figure 1). In contrast, Chinese equities trade at close-to-historic valuation discounts, which reflect the concerns about growth, not to mention other risks, including geopolitics.
Figure 1: India versus China—Divergence in Valuation Premia
Composite valuation premium based on several metrics relative to their long-term averages

The rise to prominence of Rising Tiger, Falling Dragon, like other EM investing themes that have preceded it, including BRICS, BATTS, and the Fragile Five, to name just a few, does not represent a nuanced view.1 It has been propelled by price patterns that have already manifested in markets. While it is certainly possible that those trends will persist, key judgments that should be on the minds of thematic investors are 1) whether the market is now under- or overvaluing the broad economic outlook and 2) whether they can time the further evolution of sentiment (perhaps, even, to find a “greater fool”).
Such assessments are hardly trivial. In fact, investors may recall that roughly a decade ago India was part of the Fragile Five EM investing theme, which decried a group of countries then viewed as vulnerable to exogenous economic shocks. At the time, there was fear that the Indian economy was vulnerable to capital outflows and, as a result, financial instability. In retrospect, Indian equities then traded at attractive valuations, weighed down by investor sentiment that was, with the benefit of hindsight, too negative.
India and China: Don’t Ignore the Cross Section
In chasing broad macro themes, investors often focus on high-level views and overlook variation in fundamentals within the cross section, neglecting opportunities for near-term stock selection. Rising Tiger, Falling Dragon is no exception. Investors who embraced the theme without scrutinizing variation in fundamentals within each market left opportunity on the table: fundamentally grounded signals, including value and quality, have paid off handsomely in both India and China.
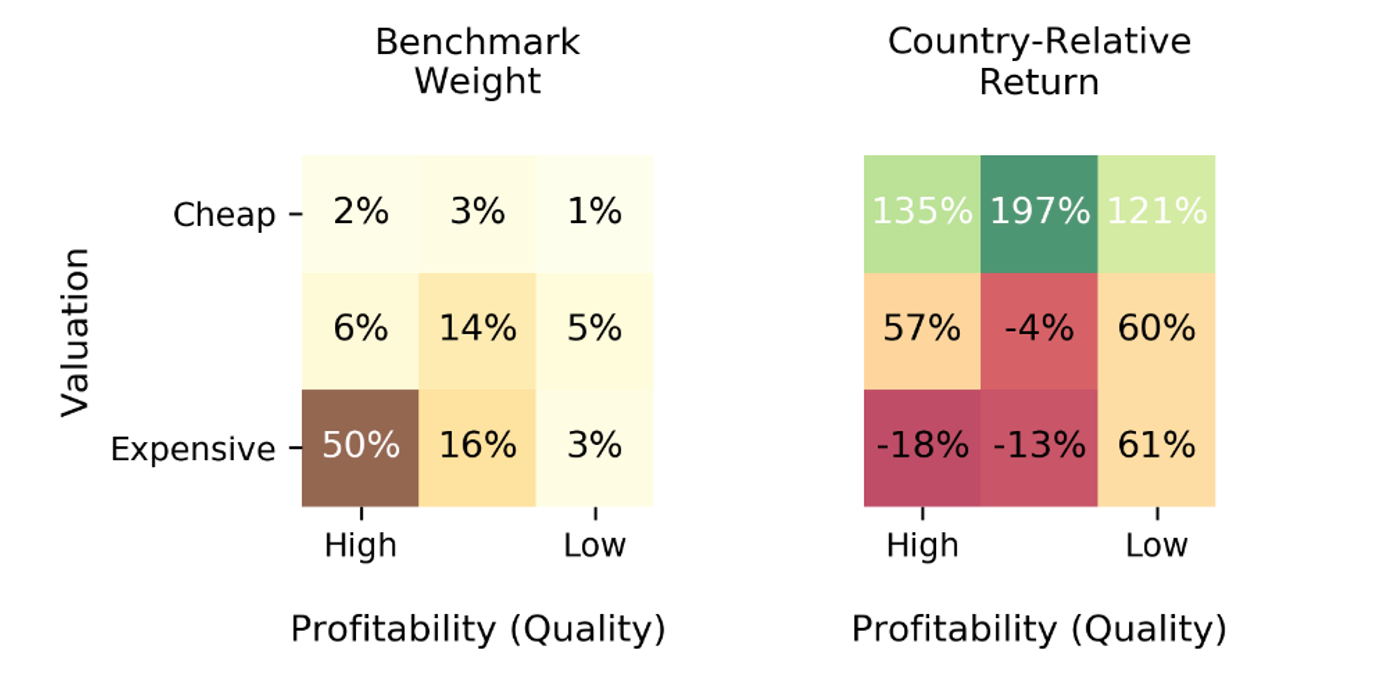
In India, thematic investors that allocated via country baskets have earned strong returns since 2021, roughly 60% (USD). Yet they could have done even better by tilting towards cheaper, higher-quality stocks. That is because, as shown in Figure 2a, the cap-weighted country basket has been heavily weighted in high-quality but expensive names (left panel), and those stocks have underperformed (right panel).
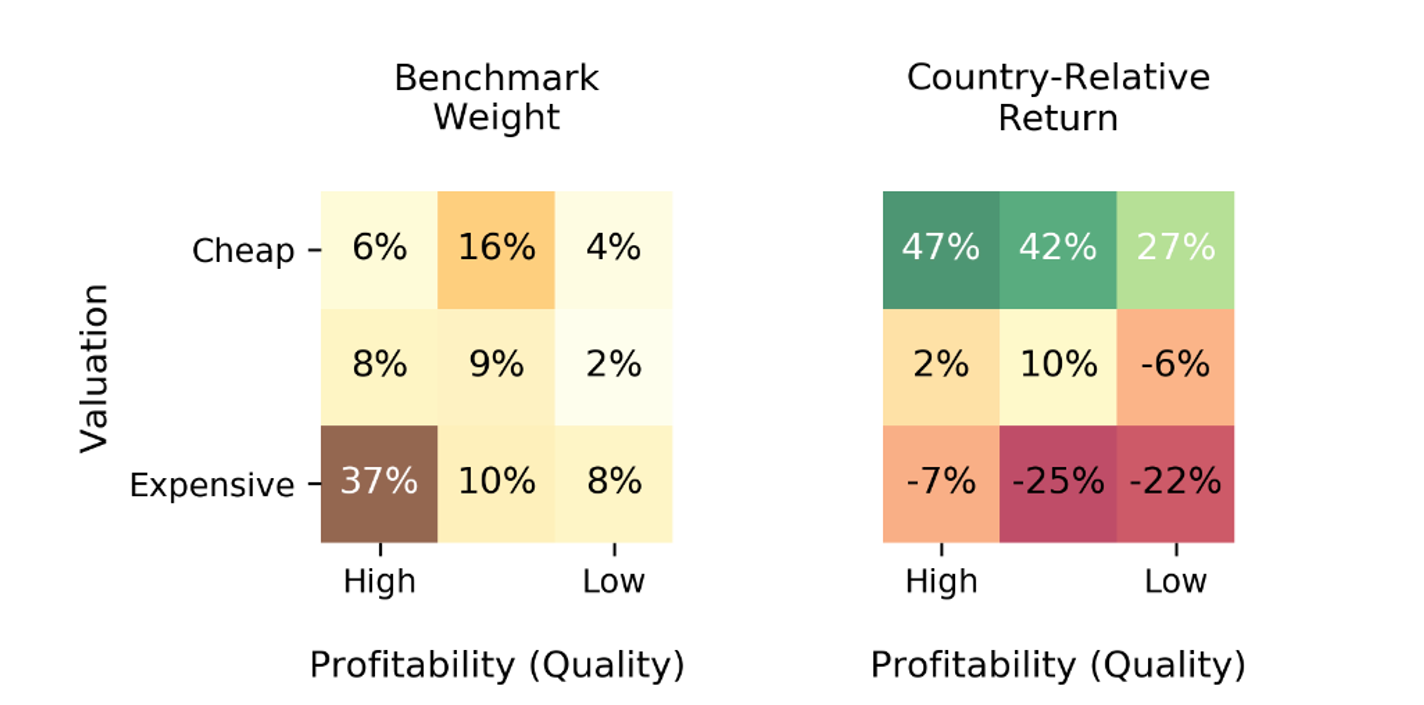
In China, macro concerns not only depressed index returns (-46% USD since 2021) but also prompted thematic shorts. Investors who held negative views on the country would have benefited from relative underweights in or by shorting expensive, lower-quality companies rather than expressing the bearish view through the cap-weighted basket. Figure 2b shows that in the MSCI China IMI Index, higher-quality stocks have had a substantial weight, and they have held up relatively well, even expensive ones. Stocks that were both expensive and lower quality have suffered the greatest losses.
Figure 2: Benchmark Weights and Returns by Value and Profitability Terciles
Stocks in each country sorted independently on the basis of valuation and profitability
Panel a: India
Panel b: China
EM Investing: Are We Tired of Memes Yet?
The EM domain seems especially prone to theme-driven investing, and it does not serve investors well. First, thematic macro investing, almost by nature, implies embracing narrow bets and timing market sentiment. For a recent reminder of the level of risk that this entails, we need look no further than at the fortunes of the BATTS.
Over roughly a four-year stretch, from 2017-20, these mega-cap EM tech stocks ran-up 30% p.a., easily beating benchmarks. When the BATTS-centric growth theme ended in late 2020, however, investors lost close to a quarter of their prior three-year outperformance in about forty trading days.2 What’s more, investors who held on to these growth stocks for another year ended up forfeiting the bulk of their prior gains. The suddenness and severity of the reversion highlights the challenge of timing themes.
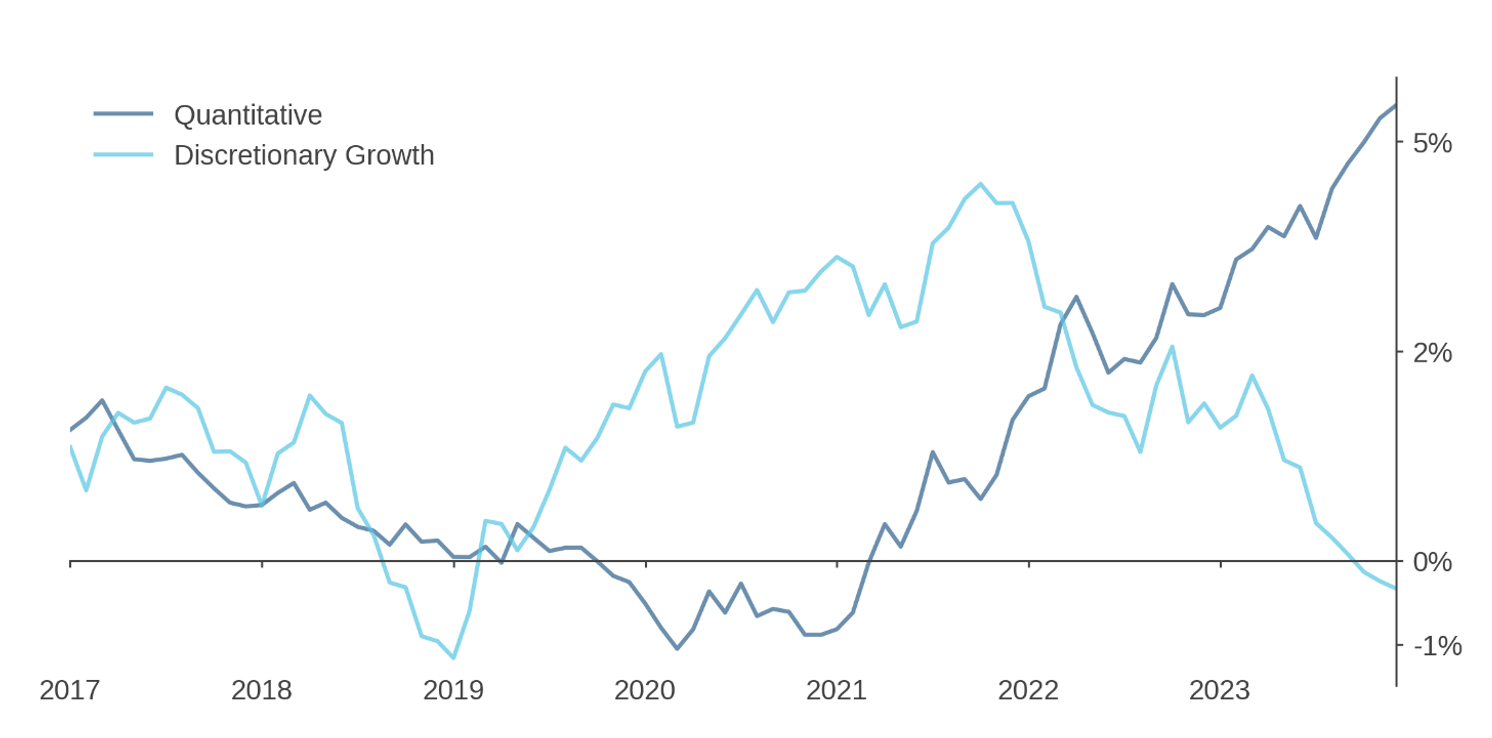
Figure 3 captures the rise and fall of the BATTS through active manager performance. The light blue trace shows the active returns of discretionary, growth-oriented managers, many of which leaned into the BATTS. They first delivered historically uncharacteristic excess returns, but that excess performance evaporated as the BATTS melted down.3 In contrast, performance of broader stock selection-based strategies that seek to harvest cross-sectional mispricings were to some degree anti-correlated with the theme, arguably harmed by market distortions as sentiment overwhelmed fundamentals. Over the full period, however, they have performed substantially better, especially as frothy sentiment unwound over the past few years.
Figure 3: The Rise and Fall of BATTS
Rolling 36-month average medial excess return versus MSCI EM benchmark
Moreover, even if the view implicit in a theme proves correct, its narrow conceptualization or implementation may not maximize participation in the underlying opportunities that are driving it. For example, part of the motivation for bullishness over India is rooted in hopes that the country’s economy will benefit from reglobalization, i.e., the expectation that companies will diversify supply chains as a result of lessons learned from COVID and ongoing tensions between the U.S. and China. But rather than expressing the reglobalization theme through India alone, why not spread the bet across EM and beyond—e.g., to Mexico and other countries in Latin America as well as to Vietnam—to improve the odds of benefitting from the trend? We believe that it is still unclear who will benefit most from the reconfiguration of global trade networks.
More broadly, trends in fundamentals that have helped to fuel the Rising Tiger, Falling Dragon theme have manifested elsewhere in EM. Figure 4 shows that, echoing the pattern in China, Korea and Taiwan have also suffered declines in earnings growth in recent years. Meanwhile, several smaller EMs have enjoyed even greater increases in earnings growth than India, including consumption-oriented markets like Indonesia and South Africa and commodities-driven economies, like Saudia Arabia and UAE. The point is that macro-driven opportunities associated with Rising Tiger, Falling Dragon may be available elsewhere in the full EM country cross section. And in casting a wide net for such opportunities, we would also advise investors to carefully factor in valuations and sentiment, not just economic or fundamental growth.
Figure 4: Shifts in Earnings Growth across EM
Average annual cash-earnings growth by country

Conclusion
Might it still be worth embracing the Rising Tiger, Falling Dragon theme? Possibly. But the risk is hardly trivial, and evaluation of the trade should be based on much more than just extrapolation of prior returns or even the macroeconomic picture.
More broadly, based on our experience in EM, we would encourage investors to look past the trendy themes that have come and gone in the asset class. The full cross section of EM stocks offers a consistently rich reservoir of mispricings for sophisticated managers to exploit. Instead of timing narrow themes, stay invested, stay diversified, and embrace active strategies that cast a wide net and employ a broad information set.
Endnotes
- BRICS: Brazil, India, Russia, S. Africa, and China; Fragile Five: Brazil, India, Indonesia, S. Africa, and Turkey; BATTS: Baidu, Alibaba, Tencent, Taiwan Semiconductor, Samsung. References to these and any other companies in this write-up should not be construed as recommendations to buy or sell any specific securities.
- Based on MSCI EM Growth Index vs MSCI EM Index.
- Reflections on a Generation of Investing in EM Equities, Acadian, February 2024.
Additional Disclosure
Figure 3: eVestment Alliance, LLC, and its affiliated entities (collectively, eVestment”) collect information directly from investment management firms and other sources believed to be reliable, however, eVestment does not guarantee or warrant the accuracy, timeliness, or completeness of the information provided and is not responsible for any errors or omissions. Performance results may be provided with additional disclosures available on eVestment’s systems and other important considerations such as fees that may be applicable. Not for general distribution and limited distribution may only be made pursuant to client’s agreement terms. All managers in an eVestment category are not necessarily included. Copyright 2012-2024 eVestment Alliance, LLC. All Rights Reserved
Legal Disclaimer
These materials provided herein may contain material, non-public information within the meaning of the United States Federal Securities Laws with respect to Acadian Asset Management LLC, Acadian Asset Management Inc. and/or their respective subsidiaries and affiliated entities. The recipient of these materials agrees that it will not use any confidential information that may be contained herein to execute or recommend transactions in securities. The recipient further acknowledges that it is aware that United States Federal and State securities laws prohibit any person or entity who has material, non-public information about a publicly-traded company from purchasing or selling securities of such company, or from communicating such information to any other person or entity under circumstances in which it is reasonably foreseeable that such person or entity is likely to sell or purchase such securities.
Acadian provides this material as a general overview of the firm, our processes and our investment capabilities. It has been provided for informational purposes only. It does not constitute or form part of any offer to issue or sell, or any solicitation of any offer to subscribe or to purchase, shares, units or other interests in investments that may be referred to herein and must not be construed as investment or financial product advice. Acadian has not considered any reader's financial situation, objective or needs in providing the relevant information.
The value of investments may fall as well as rise and you may not get back your original investment. Past performance is not necessarily a guide to future performance or returns. Acadian has taken all reasonable care to ensure that the information contained in this material is accurate at the time of its distribution, no representation or warranty, express or implied, is made as to the accuracy, reliability or completeness of such information.
This material contains privileged and confidential information and is intended only for the recipient/s. Any distribution, reproduction or other use of this presentation by recipients is strictly prohibited. If you are not the intended recipient and this presentation has been sent or passed on to you in error, please contact us immediately. Confidentiality and privilege are not lost by this presentation having been sent or passed on to you in error.
Acadian’s quantitative investment process is supported by extensive proprietary computer code. Acadian’s researchers, software developers, and IT teams follow a structured design, development, testing, change control, and review processes during the development of its systems and the implementation within our investment process. These controls and their effectiveness are subject to regular internal reviews, at least annual independent review by our SOC1 auditor. However, despite these extensive controls it is possible that errors may occur in coding and within the investment process, as is the case with any complex software or data-driven model, and no guarantee or warranty can be provided that any quantitative investment model is completely free of errors. Any such errors could have a negative impact on investment results. We have in place control systems and processes which are intended to identify in a timely manner any such errors which would have a material impact on the investment process.
Acadian Asset Management LLC has wholly owned affiliates located in London, Singapore, and Sydney. Pursuant to the terms of service level agreements with each affiliate, employees of Acadian Asset Management LLC may provide certain services on behalf of each affiliate and employees of each affiliate may provide certain administrative services, including marketing and client service, on behalf of Acadian Asset Management LLC.
Acadian Asset Management LLC is registered as an investment adviser with the U.S. Securities and Exchange Commission. Registration of an investment adviser does not imply any level of skill or training.
Acadian Asset Management (Singapore) Pte Ltd, (Registration Number: 199902125D) is licensed by the Monetary Authority of Singapore. It is also registered as an investment adviser with the U.S. Securities and Exchange Commission.
Acadian Asset Management (Australia) Limited (ABN 41 114 200 127) is the holder of Australian financial services license number 291872 ("AFSL"). It is also registered as an investment adviser with the U.S. Securities and Exchange Commission. Under the terms of its AFSL, Acadian Asset Management (Australia) Limited is limited to providing the financial services under its license to wholesale clients only. This marketing material is not to be provided to retail clients.
Acadian Asset Management (UK) Limited is authorized and regulated by the Financial Conduct Authority ('the FCA') and is a limited liability company incorporated in England and Wales with company number 05644066. Acadian Asset Management (UK) Limited will only make this material available to Professional Clients and Eligible Counterparties as defined by the FCA under the Markets in Financial Instruments Directive, or to Qualified Investors in Switzerland as defined in the Collective Investment Schemes Act, as applicable.
About the Authors